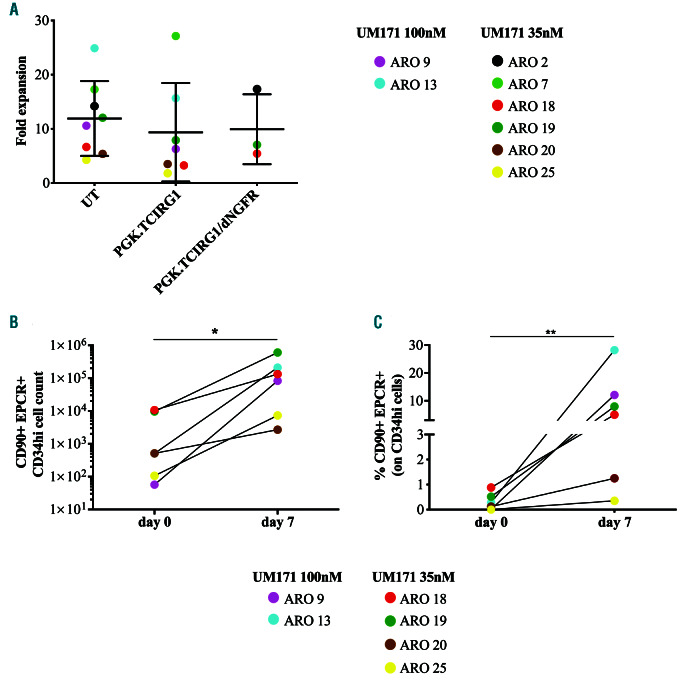
Figure 4.
Hematopoietic stem and progenitor cells (HSPC) expansion. (A) Fold expansion, calculated as a ratio between total CD34+ cells at the start of the culture and at the end of expansion phase in untransduced (UT) or transduced (PGK.TCIRG1 and PGK.TCIRG1/dNGFR) patient cells. (B) Absolute counts of the CD34high CD90+ endothelial protein C receptor-positive (EPCR+) population, which is enriched for the long-term hematopoietic stem cells (HSC), at day 0 (freshly isolated CD34+ cells) and day 7 (end of expansion phase). Each color represents a different untransduced patient, cultured with 35 or 100 nM UM171, as indicated in figure. (C) Frequency of the CD90+ EPCR+ population on the CD34high cells at day 0 and at day 7. As in (A), each color represents a different untransduced patient, cultured with 35 or 100 nM UM171, as indicated in figure. Statistical significance was determined by non-parametric one-way ANOVA with Dunns post test (A) or non-parametric Mann Whitney test (B and C). *P<0.05, **P<0.01. Data show mean±standard deviation.

