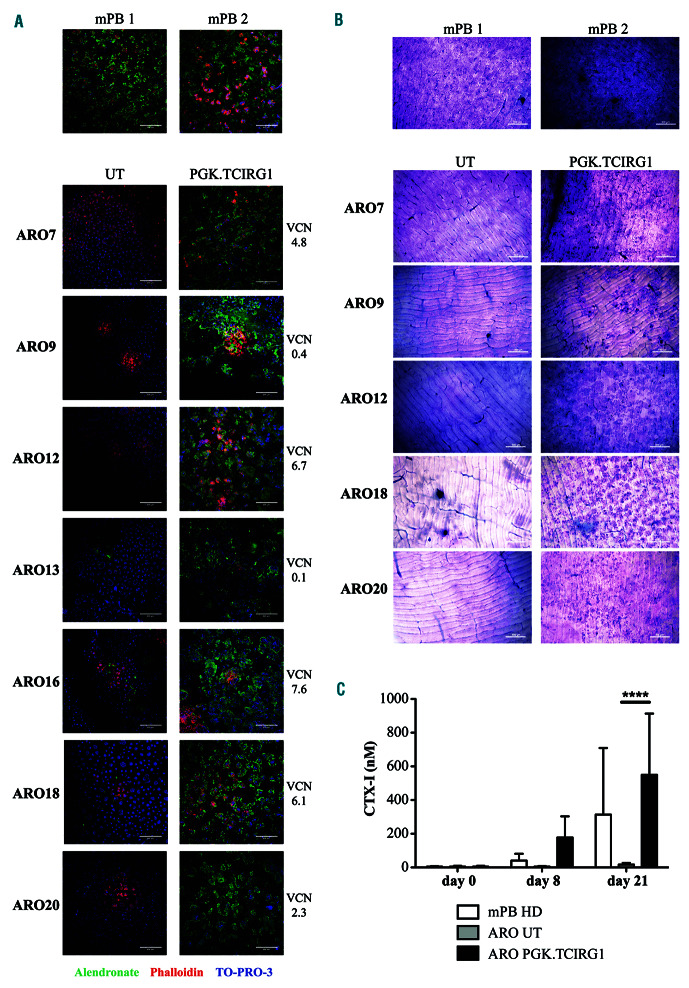
Figure 5.
Osteoclast bone resorption. (A) Immunofluorescence staining of osteoclasts differentiated from CD34+ cells and cultured on bone slices. Images show the merge result of alendronate-AF-488 (resorption pits in green), phalloidin-TRITC (actin rings in red) and TO-PRO-3 (nuclei in blue). (Top) Representative images of osteoclasts obtained from mobilized peripheral blood (mPB) CD34+ cells from two healthy donors. (Bottom) Representative images of untransduced (UT) or transduced (PGK.TCIRG1) osteoclasts from seven ARO patients. Vector copy numbers (VCN) of the transduced cells are indicated for each patient. Images were acquired with Leica TCS SP5 laser scanning confocal, equipped with HC PL FLUOTAR 10X (NA 0.3) dry and Leica Application Suite Advanced Fluorescence (LASAF) software. (B) Toluidine blue staining of bone slices that were previously cultured with osteoclasts from healthy donor mPB CD34+ cells and ARO patient UT or transduced (PGK.TCIRG1) cells. VCN of the transduced cells are shown for each patient. Images were acquired with Nikon ECLIPSE E600 microscope equipped with Nikon DSRi2 camera, using Plan Fluor 4x/0.13 objective and NIS-Elements F 4.30.01 software. (C) C-terminal telopeptide fragment of type I collagen (CTX-I) quantification in the osteoclast culture supernatant at day 0, day 8, and day 21. Healthy donor mPB (mPB HD) CD34+ cells in white, ARO patient untransduced (ARO UT) cells in gray and ARO patient transduced (ARO PGK.TCIRG1) in black. Statistical significance was determined by two-way ANOVA with Bonferroni post-test (C). ****P<0.0001. All data show mean±standard.

