Figure 7.
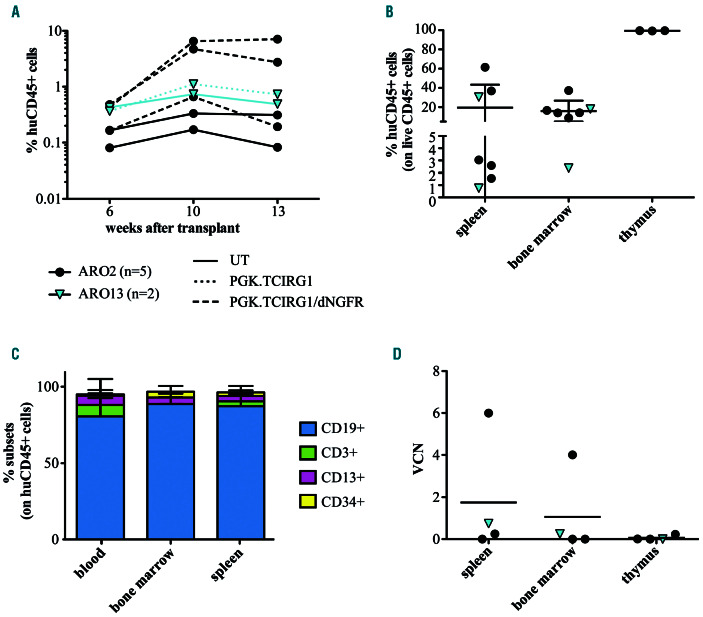
Transplants in secondary NOD scid gamma common chain (NSG) recipients. (A) Percentage of human hematopoietic (huCD45+) cells in the peripheral blood (PB) of secondary NSG recipients over time. Each color represents a different patient, as indicated in figure. Continuous line indicates untransduced (UT) cells, dotted line indicates cells transduced with PGK.TCIRG1 vector and dashed line indicates cells transduced with PGK.TCIRG1/dNGFR vector. (B) Percentage of human hematopoietic (huCD45+) cells on total CD45+ cells in spleen, bone marrow (BM) and thymus at sacrifice. (C) Percentage of CD19+ (B lymphocytes, in blue), CD3+ (T lymphocytes, in green), CD13+ (myeloid cells, in pink), and CD34+ (hematopoietic stem and progenitor cells, in yellow) subsets on the total human CD45+ cells. (D) Vector copy number (VCN) of in vitro transplanted cells and in tissues (spleen, BM and thymus). Data show mean (D) or mean±standard deviation (B and C).

