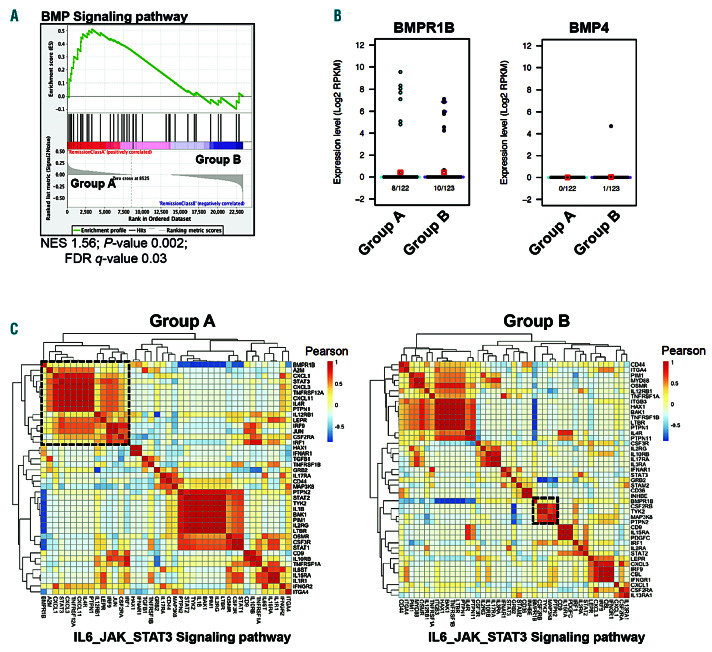
Figure 1.
BMPR1B-positive chronic myeloid leukemia (CML) persistent cells signal through the Stat3 pathway. (A) Gene set enrichment analysis (GSEA) of group A versus group B BCR-ABL+ stem cells (SC) at remission (n=122 and n=123, respectively). Gene set shown is bone morphogenetic proteins (BMP) signaling pathway. (B) Beeswarm plot of BMPR1B (left) or BMP4 (right) expression between group A (light blue; n=122) and group B BCR-ABL+ SC from patients at remission (purple; n=123). Number of cells analyzed and displaying amplification for the selected genes are shown below the plot. Average gene expression level is indicated by red squares; boxes represent the median and quartiles of gene expression levels. (C) Heat map shows hierarchical clustering of IL6_JAK_STAT3 signaling pathway genes in BMPR1B+ cells (n=8) from group A BCR-ABL+ SC (left) or group B BCR-ABL+ SC (right). FDR: false discovery rate.

