Figure 2.
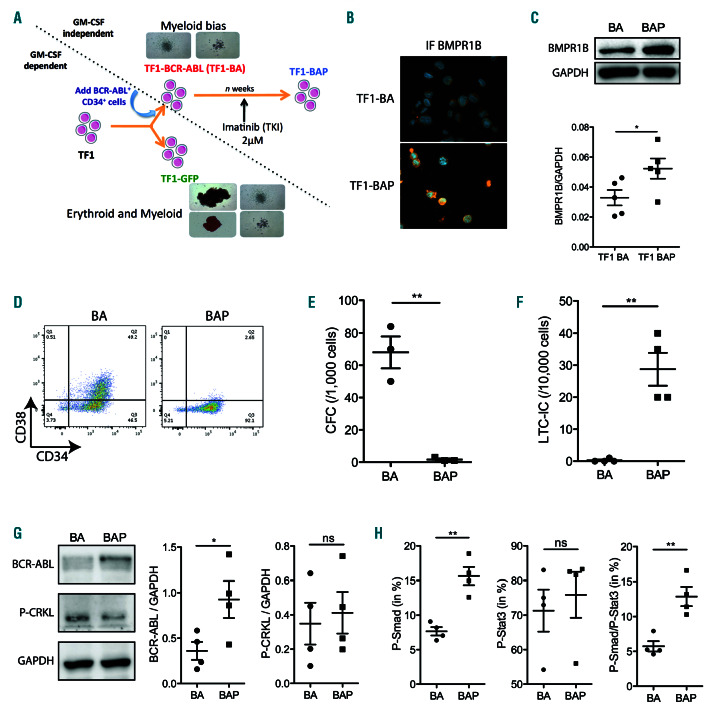
The TF1-BAP model displays similar features as chronic myeloid leukemia (CML) persistent cells. (A) Strategy for generating TF1-BA and TF1-BAP cell lines. (B) Representative images of BMPR1B staining of TF1-BA and TF1-BAP cells. (C) Western blot analysis showing BMPR1B levels in TF1-BA and TF1-BAP cells; Scatter plot showing BMPR1B (GAPDH used as an internal control) n=5. (D) Representative FACS plots of TF1-BA and TF1-BAP cells analyzed for their CD34 and CD38 content. (E) Dot plot showing colony forming cell (CFC) activity from TF1-BA and TF1-BAP cells. (F) Dot plot showing long-term culture-initiating cell (LTC-IC) activity from TF1-BA and TF1-BAP cells. (G) Western blot analysis showing BCR-Abl and P-CRKL levels in TF1-BA and TF1-BAP cells. Bar graph showing BCR-Abl and P-CRKL (GAPDH used as an internal control); n=4. (H) TF1-BA and TF1-BAP cells were analyzed for their content in P-Smad1/5/8 and P-Stat3. Dot plots represent percentage of PSmad1/ 5/8 (left panel), P-Stat3 (middle panel) or double positive P-Smad1/5/8-P-Stat3 (right panel). (E-H) Unpaired t-test significant: *P≤0.05, **P≤0.01. ns: not significant.

