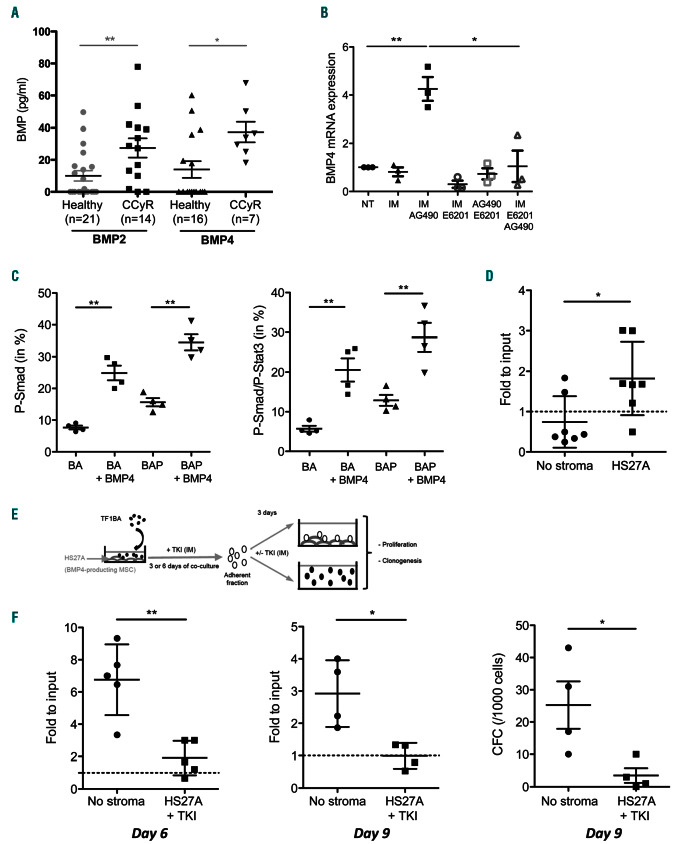
Figure 4.
Chronic myeloid leukemia (CML) niche promotes tyrosine kinase inhibitor (TKI) persistence of leukemic cells. (A) ELISA quantification of BMP2 and BMP4 in bone marrow (BM) plasma obtained from healthy donors and complete cytogenetic remission (CcyR) patients. Results from individual samples are expressed in picograms per milliliter, and horizontal lines represent mean values±standard error of mean (SEM) of the indicated number of analyzed samples. (B) Mesenchymal stem cells from CML patients were treated with imatinib (IM), and/or AG490, and/or E6201 for 3 days. BMP4-transcript expression from three samples is expressed in arbitrary units, and lines represent mean values±SEM, compared to untreated (NT). (C) TF1-BA and TF1-BAP cells treated or not with BMP4 (20 ng/mL for 24 hours) were analyzed for their content in P-Smad1/5/8 (left panel), or double positive P-Smad1/5/8-P-STAT3 (right panel). (D) TF1-BA cells were cultured in suspension or seeded on top of a HS27A layer and then treated for 6 days with IM (1.5 μM) before viable cell number was analyzed. Scatter plot showing fold to input (day 6/day 0), with dashed line representing no proliferation compared to input; n=7. (E) Experimental protocol for analysis of TKI persistence of leukemic cells promoted by stroma. TF1-BA cells were seeded on top of a HS27A layer for 3 or 6 days with imatinib (IM) (1.5 M), before adherent TF1-BA were harvested and further divided into suspended cells without IM or seeded on top of a HS27A layer with IM. (F) After 3 days, cell numbers were analyzed (left and middle) or colony forming cell (CFC) assays were performed (right). Scatter plots showing fold to input: Day 6 / Day 3 (left), Day 9 / Day 6 (middle), or CFC activity (right). Mann-Whitney test: *P≤0.05, **P≤0.01.

