Fig. 2.
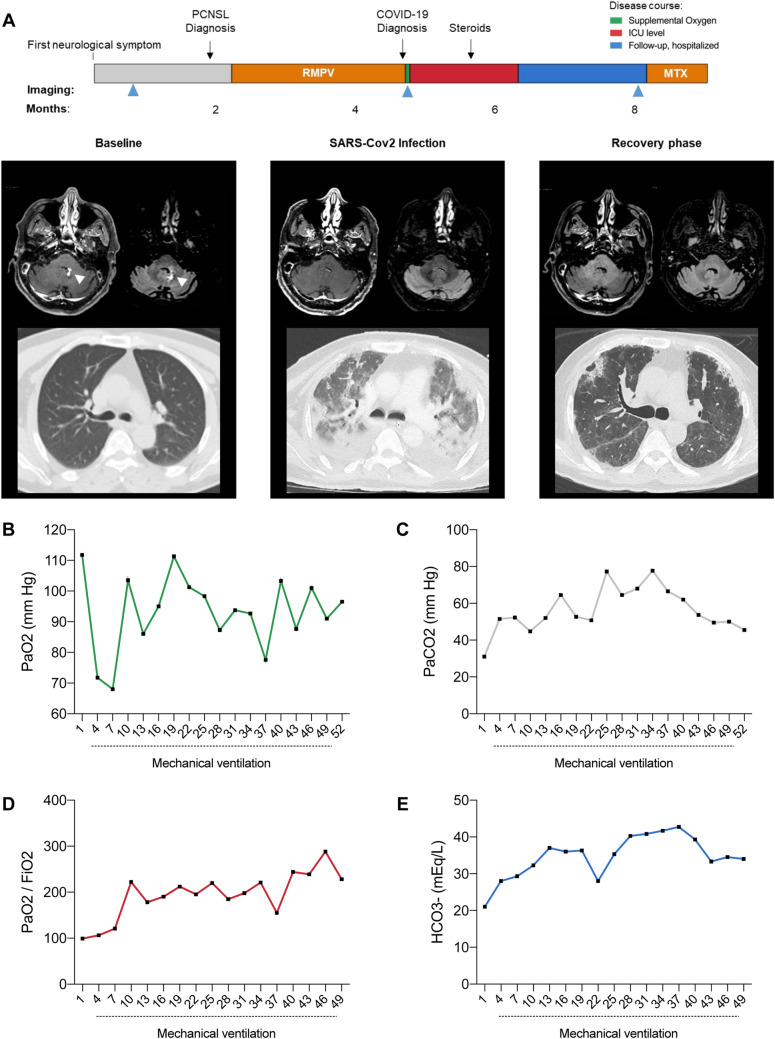
Severe COVID-19 Infection in a 65-year-old patient with PCNSL. a Clinical Timeline. Top, timeline; bottom, brain MRI (left, T1-Gad; right, FLAIR) and lung CT-scan images during initial PCNSL diagnosis (left), SARS-Cov2 infection, and the recovery phase. b–e Evolution of gas exchange parameters during SARS-Cov2 infection

