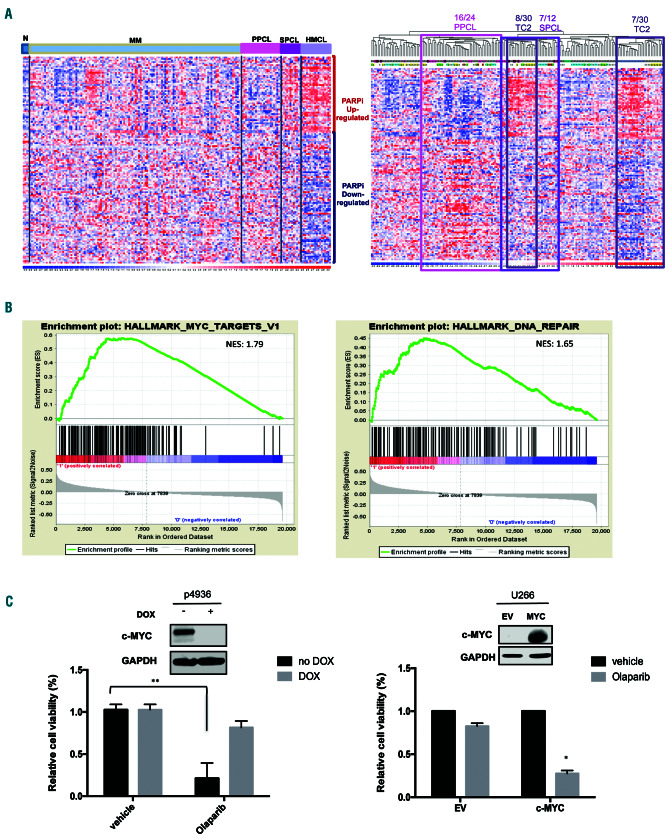
Figure 4.
MYC drives sensitivity to PARP inhibition. (A) Hierarchical agglomerative clustering of samples of plasma cell dyscrasias on PARP inhibitor gene expression signature. Types of samples (normal [N], multiple myeloma [MM], primary plasma cell leukemia [PPCL], secondary plasma cell leukemia [SPCL], human myeloma cell lines [HMCL]) and MM translocations/cyclins classes (TC1, TC2, TC3, TC4, TC5) are depicted in different colors. The color scale bar represents the relative gene expression changes normalized by the standard deviation. PPCL, SPCL and MM-TC2 significant clusters are highlighted: 16/24 PPCL, P=4x10⁻⁴; 7/12 SPCL P=8.4x10⁻³; 8/30 TC2, P=6.5x10⁻³; 7/30 TC2, P=9.4x10⁻³. (B) Enrichment plots of selected significant (nominal P<0.05) gene sets by gene set enrichment analysis on PARP inhibitor-positive versus PARP inhibitor-negative MM-TC2 cases. Normalized enrichment scores (NES) are indicated. (C) Lef t panel: cell viability analysis in P493-6 cells after 7 days of exposure to vehicle or olaparib (5 mM), in the presence of doxycycline (DOX: 500 ng/mL) (low MYC) or in its absence (high MYC). Right panel: cell viability analysis in U266 empty vector (EV) and U266 MYC-positive cells after 7 days of exposure to vehicle or olaparib (5 mM). Data are representative of at least three independent experiments. *P<0.05; **P<0.01.

