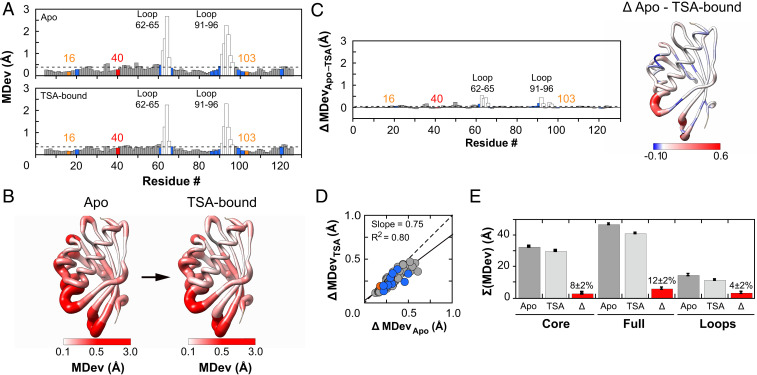
Fig. 3.
Assessing conformational heterogeneity through the KSI catalytic cycle via pseudoensembles. (A) Cα MDevs for KSI Apo (Upper) and TSA–bound (Lower) states. Dashed lines represent the average MDev. The flexible 62–65 and 91–96 loops are shown as white bars, Y16 and D103 in orange, D40 in red, and binding residues in blue. (B) Worm representation of the MDevs from A on the 3D structure of KSI. The thickness of the worm representation follows the color code (from white [MDev ≤ 0.1 Å] to red [MDev ≥ 0.5 Å]). (C) The difference Cα MDev values between the Apo and TSA-bound states (MDevApo-TSA), such that positive values indicate lower MDevs for the TSA-bound state; the bar plot shows the difference MDev values as a function of the protein sequence (Left) and the worm representation shows the difference MDev values represented on the 3D structure of KSI (Right), as in B but with a more sensitive scale to highlight the changes. (D) Correlation plot of Apo and TSA-bound Cα MDevs (excluding loops 62–65 and 91–96). The dashed line of slope 1 represents the expectation for no difference in average MDevs between the two states. Similar results were obtained with loops included (SI Appendix, Fig. S7). (E) Sum of Cα MDevs for Apo (dark gray bars), TSA-bound (light gray bars), and their difference (Δ, red bars). Errors were estimated using bootstrap analysis and error propagation (Materials and Methods and SI Appendix, Fig. S8). Side-chain MDevs (using Cβ) gave analogous results (SI Appendix, Figs. S10 and S11).

