Fig. 4.
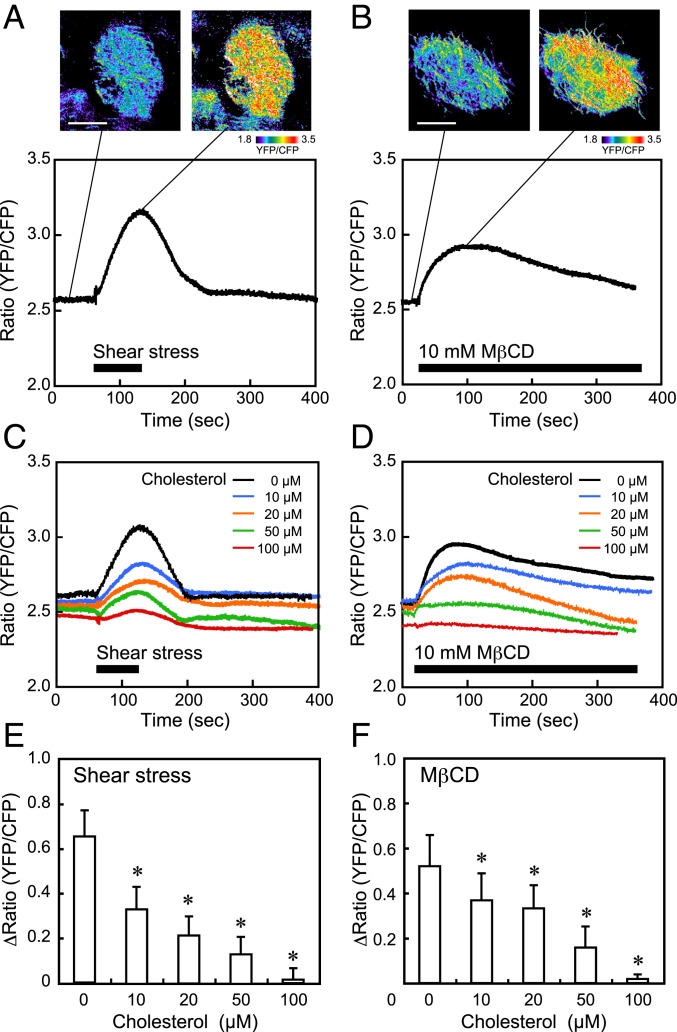
Effects of shear stress and MβCD on mitochondrial ATP levels. HPAECs were subjected to a shear stress of 15 dynes/cm2 and were examined for changes in the mitochondrial ATP level, which was determined using the FRET-based ATP biosensor mitAT1.03. (A) Typical example of shear stress-induced mitochondrial ATP production. Pseudocolor images of the YFP-to-CFP ratio showed that shear stress markedly increased the ATP levels in the mitochondria. The colors represent the ATP levels indicated by the scale. The time course of the YFP-to-CFP ratio showed that the ATP level rapidly increased in response to shear stress and then returned to the control level after the shear stress ceased. Similar mitochondrial reactions were also observed in many other cells in different experiments. (Scale bar: 20 μm.) (B) Typical example of MβCD-induced mitochondrial ATP production. The ATP levels increased rapidly in response to the treatment of cells with MβCD; after reaching the maximum level, the levels gradually declined. Similar reactions were also observed in many other cells. (Scale bar: 20 μm.) (C and D) Effects of cholesterol addition on the shear stress- and MβCD-induced increase in ATP production. Solutions with different concentrations of cholesterol (0, 10, 20, 50, and 100 μM), prepared with water-soluble cholesterol powder (Sigma-Aldrich C4951) in which cholesterol was incorporated into MβCD (molar ratio, 1:7), were added to the cells. An example of the mitochondrial ATP reaction at each concentration of cholesterol is shown. The addition of cholesterol to the cells inhibited the increasing effects of shear stress and MβCD on mitochondrial ATP production in a dose-dependent manner and almost abolished them at 100 μM cholesterol. (E and F) Quantitative analysis of the effects of cholesterol addition on mitochondrial ATP production. The bar graphs showed a dose-dependent inhibition of both shear stress- and MβCD-induced mitochondrial ATP production by the addition of cholesterol. Results are presented as the mean ± SD of 15 samples obtained in three separate experiments. All of the above experiments were performed with the cells in a confluent state. *P < 0.01 compared with the control (zero cholesterol).

