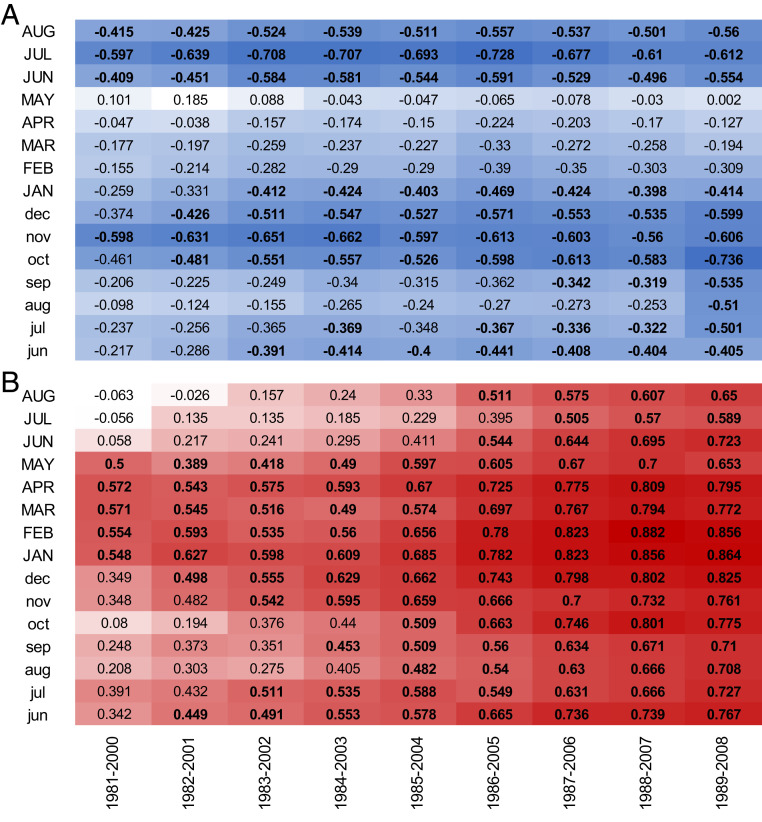
Fig. 3.
Moving window correlation analyses relating mean increaser and decreaser chronologies to monthly SIE for the Arctic Ocean. (A) Increasers (n = 13 chronologies; 363 shrubs) and (B) decreasers (n = 9 chronologies; 251 shrubs) from circumarctic area computed for period 1980 to 2008. The correlations were computed based on 1,000 bootstrapped iterations at a 20-y moving window, offset by 1 y. Significant correlations are marked in bold. Monthly SIE for current (uppercase letters) and previous year (lowercase letters) are indicated on the Left.

