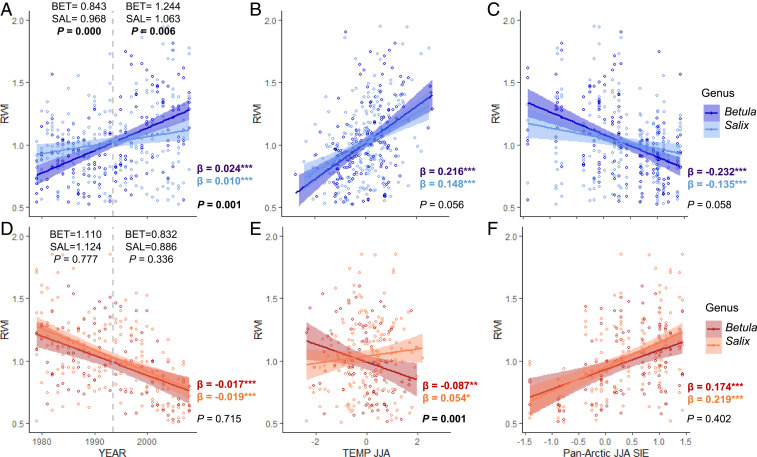
Fig. 5.
Trends in shrub growth, summer temperature, and sea ice relationships for two groups of responders aggregated per shrub genus. Standardized annual growth (RWI) of increasers (A–C; blue) and decreasers (D–F; red) between Betula (dark colors) and Salix (light colors) chronologies, together with linear relationships (and associated 95% confidence intervals) between shrub chronologies and (B and E) summer temperature (TEMP JJA) and (C and F) summer Pan-Arctic sea ice extent (JJA SIE). Significant levels for differences between the slopes are presented in the Bottom Right corner of each plot. Values marked in bold indicate a statistically significant difference (P < 0.05). In A and D plot P values from Welch’s two-sample t test are reported on the Top of the plot together with mean RWI per genus type for early (1979 to 1993) and recent (1994 to 2008) periods. Dashed line (A and D) divides early and recent periods. Linear regression slopes with significant levels (*P < 0.05, **P < 0.01, ***P < 0.001) for each relationship and entire study period (1979–2008) are reported in the Bottom Left corner of each plot (Betula, dark font; Salix, light font). N increasers = 6 (180) and 7 (210) for Betula and Salix chronologies (mean annual RWI), respectively. N decreasers = 3 (90) and 6 (180) for Betula and Salix chronologies (mean annual RWI), respectively.

