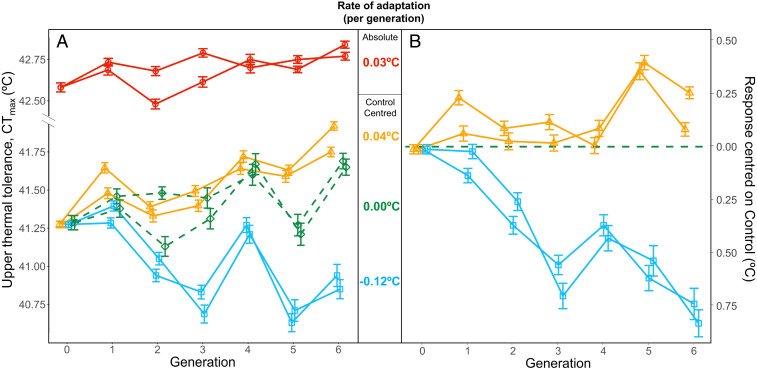
Fig. 1.
Upper thermal tolerance (CTmax) of wild-caught zebrafish over six episodes of selection. Duplicated lines were selected for increased (Up-selected, orange lines and triangles) and decreased (Down-selected, blue lines and squares) upper thermal tolerance. In addition, we had two Control lines (green dashed lines and diamonds). The Up, Down, and Control lines were all acclimated to a temperature of 28 °C. In addition, two lines were selected for increased upper thermal tolerance after 2 wk of warm acclimation at 32 °C (Acclimated Up-selected, red lines and circles). At each generation, the mean and 95% CIs of each line are shown (n ∼ 450 individuals per line). (A) Absolute upper thermal tolerance values. (B) The response to selection in the Up and Down lines centered on the Control lines (dashed green line). Difference between Up-selected and Acclimated-Up lines are shown in Fig. 3. The rate of adaptation (°C per generation) is reported for each treatment using estimates obtained from linear mixed effects models using the Control-centered response in the Up-selected and Down-selected lines and the absolute response for the Acclimated-Up lines (SE = ±0.01 °C in all lines).

