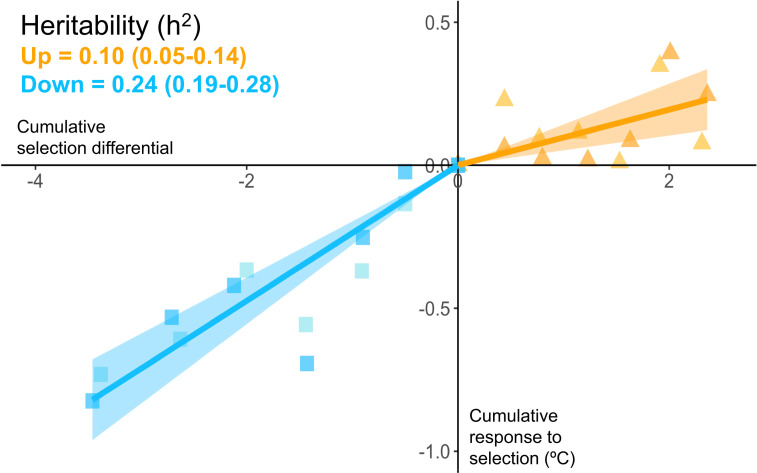
Fig. 2.
Realized heritability (h2) of upper thermal tolerance (CTmax) in wild-caught zebrafish. The realized heritability was estimated for each treatment as the slope of the regression of the cumulative response to selection on the cumulative selection differential using mixed effect models passing through the origin with replicate as a random effect. Slopes are presented with their 95% CIs (shaded area) for the Down-selected lines (blue) and Up-selected lines (orange). Data points represent the mean of each replicate line (n ∼ 450) over six generations of selection. Average selection differentials are 0.57 (Down) and 0.39 (Up), respectively, see SI Appendix, Table S1 for more information.

