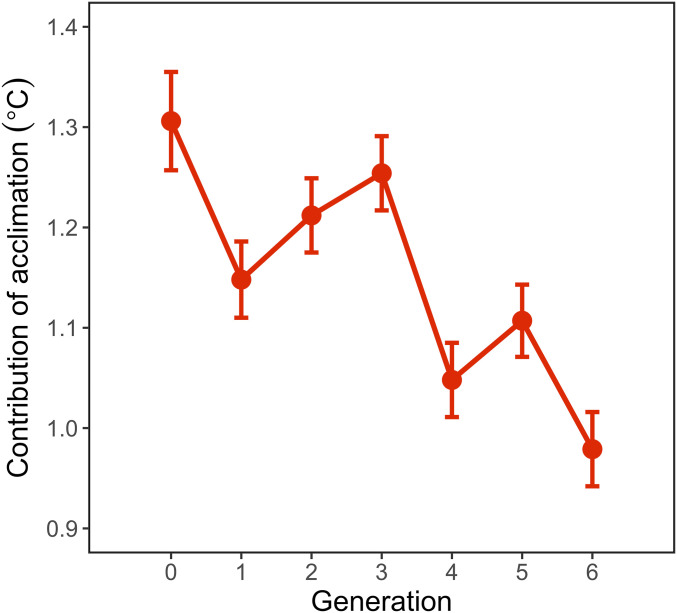
Fig. 3.
Contribution of acclimation to the upper thermal tolerance in the Acclimated-Up selected lines at each generation of selection. The contribution of acclimation was estimated as the difference between the Up and Acclimated-Up selected lines. Points and error bars represent the estimates (±SE) from a linear mixed effects model with CTmax as the response variable; Treatment (factor with two levels: Up and Acclimated Up), Generation (factor with seven levels), and their interaction as the predictor variables; and replicate line as a random factor.

