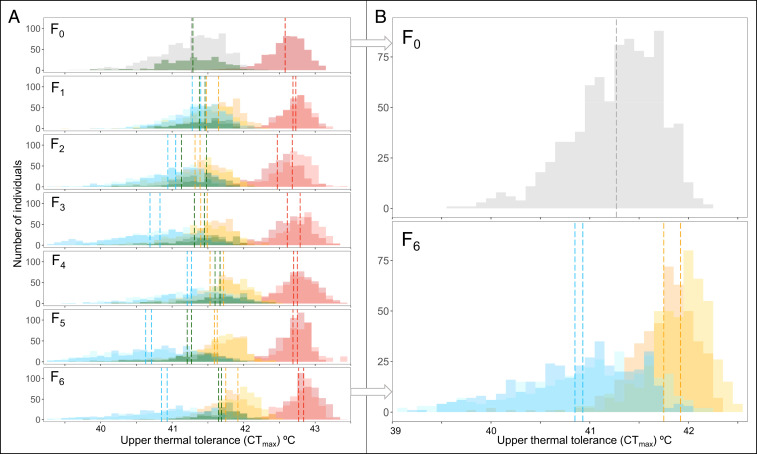
Fig. 4.
Distribution of upper thermal tolerance (CTmax) in selected lines. (A) Distribution for each line at each generation (F0 to F6). In the F0 generation, histograms show the preselection distribution in gray for the nonacclimated fish, in dark green for the Control lines, and in red for the Acclimated-Up fish. In all subsequent generations the Down-selected lines are in blue, the Up-selected lines in yellow, the Control lines in dark green, and Acclimated-up lines in red. All treatments use two shades, one for each replicate line. Dashed lines represent the mean CTmax for each line (n ∼ 450 individuals). (B) Distribution of upper thermal tolerance at the start (F0, in gray) and the end (F6, in blue and yellow) of the experiment for the Up-selected and Down-selected lines. The dashed gray line represents the mean of the Up-selected and Down-selected lines in the F0 generation preselection (n ∼ 900 individuals). Dashed blue and yellow lines represent the mean CTmax for Up and Down-selected lines for the F6 generation (n ∼ 450 individuals).

