Figure 3.
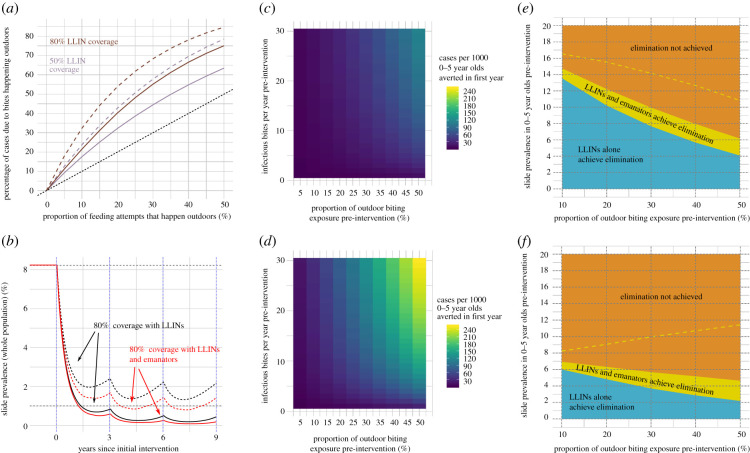
(a) The relationship between the proportion of outdoor biting (in the absence of any intervention) and the proportion of cases across the whole population due to bites happening outdoors (post-intervention) for two different LLIN coverages, 80% (brown) and 50% (purple). The effect is shown for mosquitoes with a high HBI (solid lines) and a low HBI (dashed lines). Dotted black line shows where equivalence between the two proportions would be. This value is estimated by comparing the numbers of clinical cases in two scenarios, one with observed level of coverage and the other where all outdoor biting is prevented. (b) An example of the intervention scenario where LLINs or LLINs plus emanators are distributed to 80% of the population every 3 years at years 0, 3 and 6. Again, solid lines represent mosquitoes with high HBI (92% of bitting attempts are taken on humans) and dashed lines with a low HBI (16%). It is assumed that 20% of biting happens outdoors prior to any intervention and there is no pyrethroid resistance. (c) The number of additional cases averted per 1000 0–5 year olds per year when emanators are distributed alongside LLINs for varying pre-intervention entomological inoculation rates (y-axis) and proportions of outdoor biting (x-axis). Mosquitoes are assumed to have a high HBI and full susceptibility to pyrethroids on LLINs. (d) As for (c), except for mosquitoes with a low HBI. (e) The maximum pre-intervention slide prevalence in 0–5 year olds at which LLINs alone (blue) or LLINs and emanators (yellow) can achieve elimination within 9 years (y-axis) and how this changes with the proportion of outdoor exposure in the absence of any intervention (x-axis). The dashed yellow line shows how an ‘optimal’ emanator that prevents all outdoor biting performs in addition to LLINs. Mosquitoes are assumed to have a high HBI and full susceptibility to pyrethroids on LLINs (f) Repeat of (e) but with mosquitoes with a low HBI.

