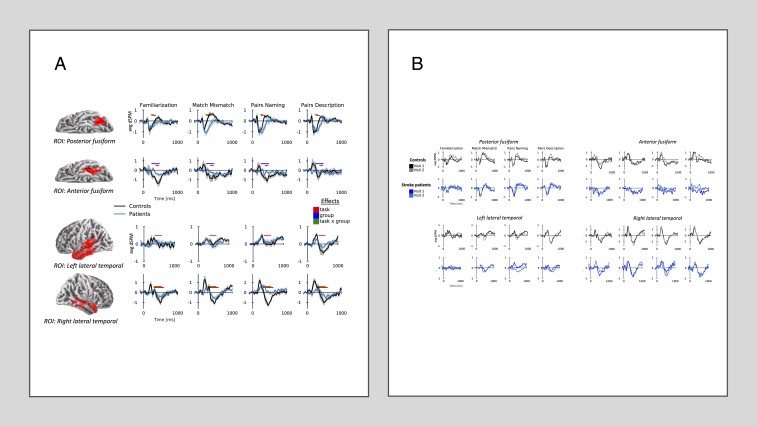
Fig. 4.
(A) At visit 1 there are task effects by the group (n = 9 patients and 8 controls) present within the fusiform gyrus and lateral temporal lobe. Bars indicate the temporal extent of significant clusters found in the spatiotemporal cluster-based analysis. Time courses are shown within ROIs defined from significant clusters, outlined in red. Times series demonstrate that for controls, the shape of the waveform varies as a function of task while remaining relatively flat and typically around zero for stroke patients. dSPM, related to a Z score, represents the current estimate normalized by the variance of the noise estimate but is averaged across sources in the ROI, which accounts for the lower amplitude compared to Fig. 1. Error bars indicate the within-subject SEM. (B) Waveforms remain consistent for both stroke patients and controls across visits. Only subjects with complete data from visits 1 and 2 (n = 6 patients and 6 controls) are displayed for comparison.

