Fig. 1.
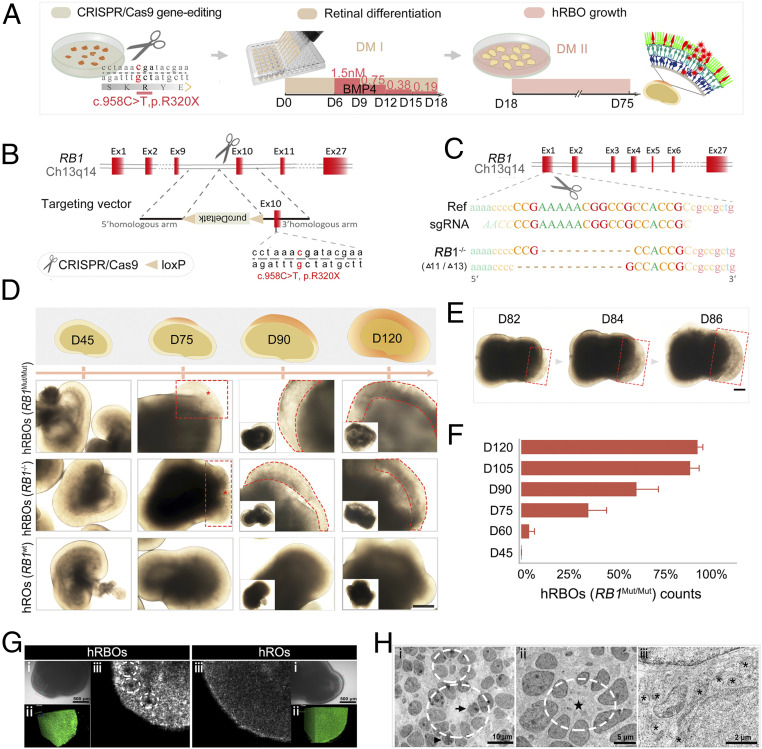
Induction of 3D hRBOs from RB1Mut/Mut and RB1−/− hESCs generated by the CRISPR-Cas9 system. (A) Scheme of the stepwise development of hRBOs. (B) Schematic view of the targeting strategy for generation of RB1Mut/Mut hESCs. (C) Targeting strategy for generation of RB1−/− hESCs. (D) Representative images of developing hRBOs in different organoid stages. (Insets) Images of the whole organoids. Wild-type hESC-derived hROs served as controls. Images in the top row show a schematic overview of developing hRBOs. Asterisks indicate the abnormal proliferating “primary foci” of the tumor. Dashed lines denote the tumor-like structures. (Scale bar: 400 µm.) (E) Representative images show the rapid expansion of tumor-like structures (dashed lines) in developing hRBOs. (Scale bar: 2,000 µm.) (F) Quantification of RB1Mut/Mut hESC-derived organoids with tumor-like structures in different organoid stages. Data are mean ± SD. n = 5. (G) Imaging of superior 3D structures of hRBOs and hROs at day 90. (i) Microscope view of screening sites in organoids with extension line. (Scale bar: 500 µm.) (ii) Imaging of screening sites in 3D rotation. (iii) Imaging of screening sites at high x-axis. Dashed lines denote Flexner–Wintersteiner rosettes. See also Movies S2 and S3. (H) TEM image of cells from day 105 hRBOs. Dashed lines denote fleurettes (i) and Flexner–Wintersteiner rosettes (ii); the pentagram marks the rosette cavity. Mitotic figures (arrowheads) represent proliferating cells, which are also represented by invagination in the nucleus (arrow). (iii) Asterisks indicate abundant mitochondria with heterogeneous morphology. (Scale bars: i, 10 µm; ii, 5 µm; iii, 2 µm.)

