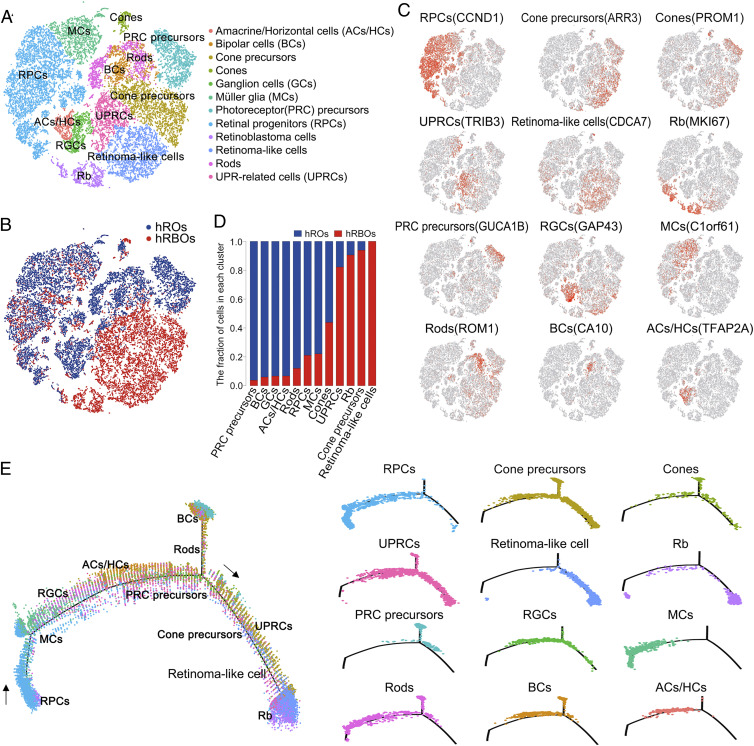
Fig. 4.
Single-cell RNA-Seq analysis of hRBOs and hROs. (A) t-distributed stochastic neighbor embedding (tSNE) visualization of 21,883 cells in 90-d-old hRBOs and control hROs profiled, with cells color-coded according to cell type annotation. (B) tSNE visualization of 21,883 cells profiled, with cells color-coded according to sample type. (C) Expression of marker genes for the main cell clusters on the tSNE map. (D) Fraction of cells in each cell cluster. (E) Monocle pseudospace trajectory revealing the Rb progression, color-coded according to cell clusters.

