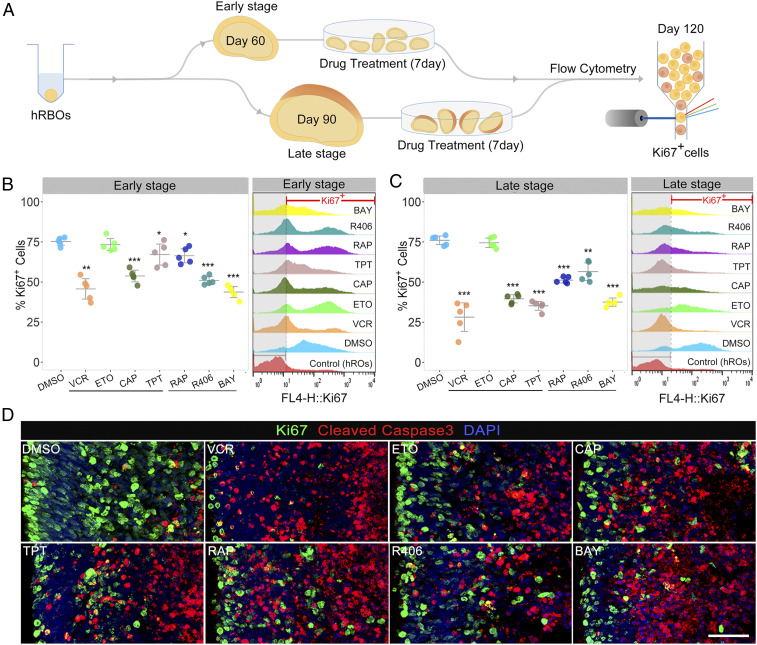
Fig. 6.
Chemotherapeutic agents for Rbs tested in hRBOs. (A) Schematic workflow of the chemotherapy treatment and assessment using hRBOs. Timelines of the culture and treatment of hRBOs are shown. (B) Representative fluorescence-activated cell sorting (FACS) profile of Ki67+ cells in day 120 hRBOs after the indicated early-stage treatment with DMSO; four currently used clinical drugs, including vincristine (VCR; final concentration: 5 nM), etoposide (ETO; 0.5 µM), carboplatin (CAB; 10 µM), and topotecan (TOP; 10 nM); and three candidate drugs, including rapamycin (RAP; 10 µM), R406 (5 µM) and BAY 61-3606 (BAY; 5 µM) (Right). Normal day 120 hROs served as a blank control. The dashed line demarcates the Ki67+ gate. (Left) Statistical analysis of the percentage of Ki67+ cells in hRBOs after the indicated treatments as analyzed by FACS. Data are mean ± SD; n = 5. *P < 0.05; **P < 0.01; ***P < 0.001, one-way analysis of variance (ANOVA) with Dunnett’s test. (C) Representative FACS profile of Ki67+ cells in day 120 hRBOs after the indicated late-stage treatment with DMSO, VCR, ETO, CAB, TOP, RAP, R406, and BAY. Normal day 120 hROs served as a blank control (Right). The dashed line demarcates the Ki67+ gate. (Left) Statistical analysis of the percentage of Ki67+ cells in hRBOs after the indicated treatments as analyzed by FACS. Data are mean ± SD; n = 5. **P < 0.01; ***P < 0.001, one-way ANOVA with Dunnett’s test. (D) Immunostaining of Ki67 (green) and apoptosis marker cleaved caspase 3 (red) in day 120 hRBOs after treatment with the indicated drugs. (Scale bar: 50 µm.)

