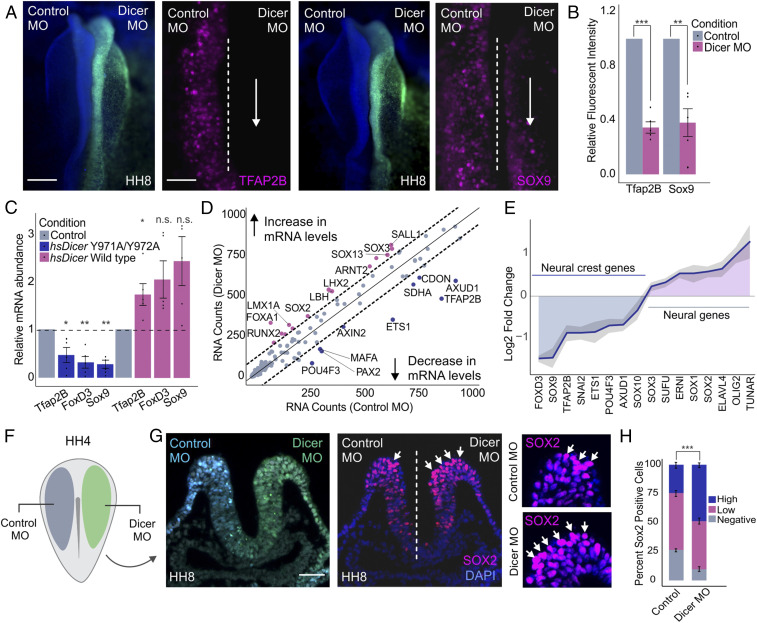
Fig. 2.
DICER is required for proper neural crest cell specification. (A) Dorsal whole-mount view of HH8 embryo with control MO on the Left and DICER MO on the Right. Immunohistochemistry for neural crest markers AP2B and SOX9 upon DICER knockdown. Dotted line represents embryo midline. (B) Quantification of TFAP2B- and SOX9-positive cells following DICER knockdown, normalized to the control side of the embryo (n = 5). (C) Quantitative RT-PCR for specification genes TFAP2B, FOXD3, and SOX9 in embryos electroporated with DICER morpholino and rescued with hsDICER wild-type or hsDICER Y971A/Y972A expression constructs. Phenotypes were assayed at stage HH8, comparing control to experimental sides of the embryo for each rescue condition (n = 5). (D) Nanostring analysis comparing gene expression profiles of control and DICER knockdown dissected neural folds of bilaterally electroporated embryos. Genes above or below the dotted lines are significantly affected upon DICER knockdown. (E) Nanostring analysis reveals changes in neural crest and neural plate gene expression profiles upon DICER knockdown. The plot represents average log2 fold change across three replicates with SD shaded in gray (n = 3). (F) Electroporation scheme for DICER loss-of-function assays in which control reagent (blue) and targeted reagent (green) were injected in different sides of a HH4 chicken embryo. (G) Immunohistochemistry (transverse section) for neural plate marker SOX2 upon DICER knockdown. Arrows point to high-intensity SOX2-positive cells in control and DICER MO sides of the embryo. (H) Quantification of SOX2-positive (low and high intensity) and -negative cells in the top 1/4 of the dorsal neural tube upon DICER knockdown, as compared to the control. P value represents Student’s t test comparing percentage of high-intensity SOX2-positive cells between control and DICER MO sides of the embryo (n = 5). Error bars in B, C, and H represent the SD. Arrowheads indicate neural crest cells. HH, Hamburger and Hamilton; n.s., not significant; MO, morpholino. *P ≤ 0.05, **P ≤ 0.01, ***P ≤ 0.001. Scale bar, 200 μM in (A). Dorsal whole-mount view of HH8 embryo with control MO on the Left and DICER MO on the Right, 100 μM in (A) immunohistochemistry for neural crest markers, 50 μM in (G).

