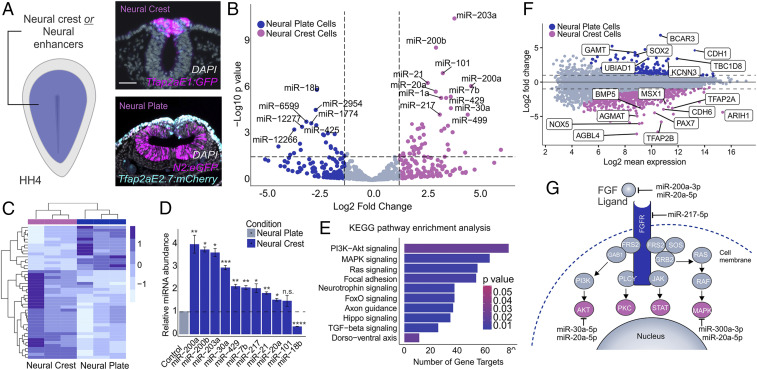
Fig. 3.
Small RNA sequencing identifies miRNAs enriched in neural crest progenitors. (A) Electroporation scheme for injection of neural crest or neural plate enhancer reporters in HH4 embryos. Transverse sections of embryos electroporated with the neural crest reporter Tfap2aE1:eGFP or the neural plate reporter N2:eGFP and Tfap2aE2.7:mCherry for exclusion of Sox2-positive neural crest cells. (B) Heatmap displaying the top significantly differentially expressed (P adj. <0.05) miRNAs between neural crest and neural plate cells. Expression levels are z-score normalized. (C) Volcano plot displaying differentially expressed miRNAs between neural crest and neural plate cells. Dotted lines represent log2 fold change and P value thresholds (P value <0.01, log2 fold change greater than or less than 1.5) for differentially expressed miRNAs. miRNAs of interest are labeled based on P value <0.001. (D) Quantitative RT-PCR for top 10 differentially expressed miRNAs in the neural crest compared to the neural plate. miR-18b serves as a negative control that should not be enriched in the neural crest relative to the neural plate. (E) miRPath analysis for top 10 neural crest-enriched miRNAs suggests several gene targets in the FGF signaling cascade (PI3K-Akt and MAPK). The plot shows the top 10 KEGG pathways identified in this analysis. (F) Intensity ratio (MA) plot from differential gene expression analysis between the neural crest and neural plate utilized in miRNA target prediction pipeline. (G) Confidently predicted neural crest miRNA gene targets within the FGF signaling pathway. Error bars in D represent the SD. HH, Hamburger and Hamilton; n.s., not significant. *P ≤ 0.05, **P ≤ 0.01, ***P ≤ 0.001, ****P ≤ 0.0001. Scale bar, 50 μM in (A).

