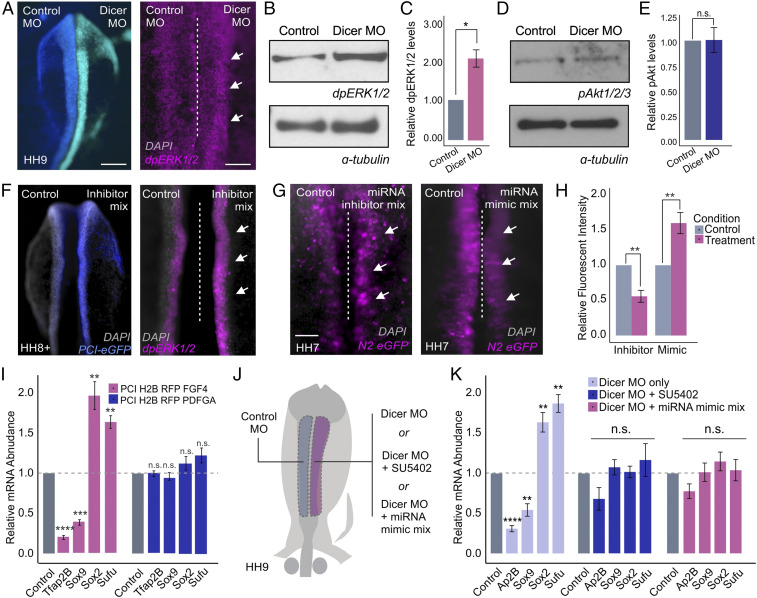
Fig. 5.
Posttranscriptional attenuation of FGF signaling is required for neural crest specification. (A) Dorsal whole-mount view of HH9 embryo with control MO on the Left and DICER MO on the Right. Immunohistochemistry for dpERK1/2 upon DICER knockdown. (B) Western blot for endogenous dpERK1/2 levels upon DICER knockdown. (C) Western blot quantification showing relative dpERK1/2 levels in control and DICER knockdown sides of bilaterally electroporated embryos, normalized to alpha-tubulin control (n = 3). (D) Western blot for endogenous pAKT1/2/3 levels upon DICER knockdown. (E) Western blot quantification showing relative pAKT1/2/3 levels in control and DICER knockdown sides of bilaterally electroporated embryos, normalized to alpha-tubulin control (n = 3). (F) Dorsal whole-mount view of HH8+ embryo with control on the Left and miRNA inhibitor mix (miR-200a, miR-20a, and miR-217) and PCI-eGFP electroporation control on the Right. Immunohistochemistry for dpERK1/2 upon miRNA inhibition. (G) Dorsal whole-mount view of HH7 embryos displaying N2:eGFP reporter activity. Embryos were bilaterally electroporated with the N2:eGFP reporter and either miRNA inhibitor or mimic mixes (miR-200a, miR-20a, and miR-217). (H) Quantification of N2:eGFP-positive cells following either miRNA inhibition or overexpression (mimic), normalized to the control side of the embryo (n = 6). (I) Quantitative RT-PCR for neural crest specification genes TFAP2B and SOX9 and neural plate genes SOX2 and SUFU in embryos electroporated with FGF4 or PDGFA overexpression constructs. Each experimental condition was normalized to the control side of unilaterally electroporated embryos for that given condition (n = 5). (J) Electroporation scheme for DICER MO rescue experiments. (K) Quantitative RT-PCR for neural crest specification genes TFAP2B and SOX9 and neural plate genes SOX2 and SUFU in embryos electroporated with DICER MO alone or rescued by incubation with SU5402 chemical inhibitor or coinjection with miRNA mimic mix (miR-200a, miR-20a, and miR-217). Each experimental condition was normalized to the control side of bilaterally electroporated embryos for that given condition (n = 6). Error bars in C, E, H, I, and K represent the SD. Arrowheads indicate neural crest cells. HH, Hamburger and Hamilton; n.s., not significant; MO, morpholino. *P ≤ 0.05, **P ≤ 0.01, ***P ≤ 0.001, ****P ≤ 0.0001. Scale bar, 200 μM in (A) and (F). Dorsal whole-mount view of embryo with control on the Left and experimental reagent on the Right, 100 μM in (A) and (F) immunohistochemistry for dpERK1/2, 100 μM in (G).

