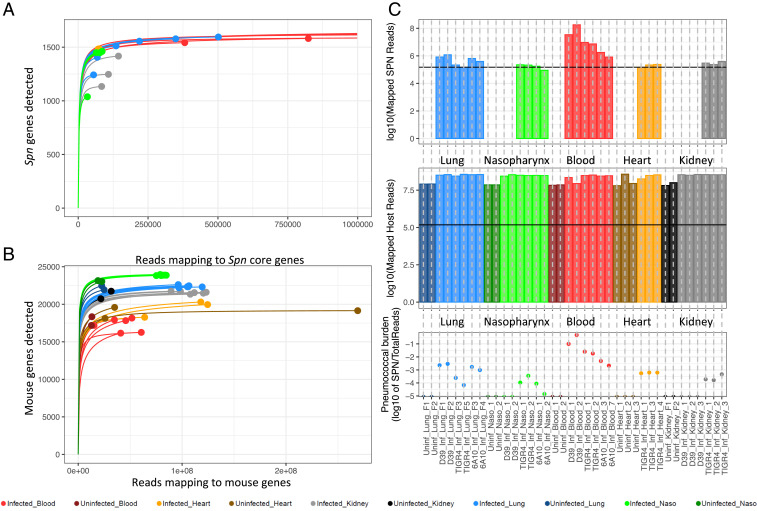
Fig. 1.
Rarefaction curves and estimation of pneumococcal burden. (A) Saturation curves of pneumococcus-infected samples. Samples whose curves plateau harbor enough reads mapped across all 1,682 core Spn genes to achieve saturation. (B) Rarefaction curves of infected and uninfected host samples. (C) Log10 values of reads mapped (Dataset S1) to the pneumococcus-infected samples (Top), host samples (Middle), and relative estimate of pneumococcal burden within each sample. Horizontal black lines (Top and Middle) indicate the minimum number of reads required for samples to plateau.

