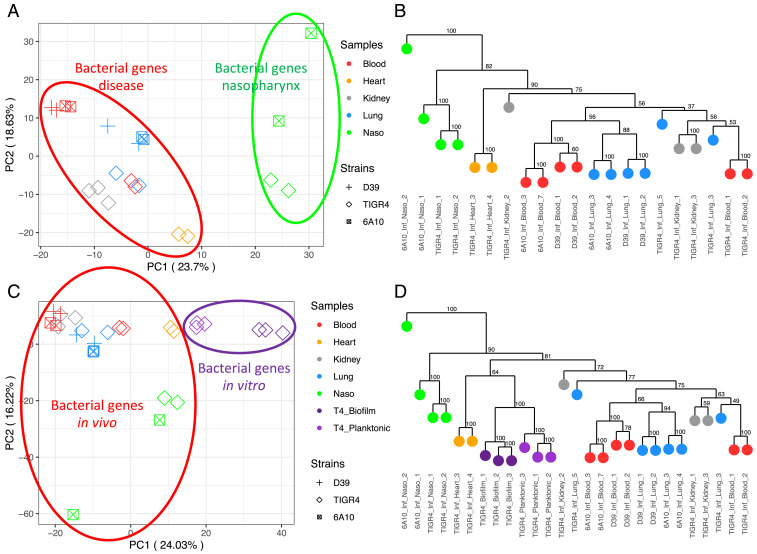
Fig. 2.
Pneumococcal PCA and dendrograms. (A) PCA of Spn gene-expression profiles (Dataset S2) across in vivo colonized or infected samples. (B) Bootstrapped dendrogram of Spn gene-expression profiles showing replicate clustering of in vivo colonized or infected samples. (C) PCA of A samples with the addition of in vitro grown planktonic and biofilm TIGR4 samples from our previous study (8). (D) Bootstrapped dendrogram with the addition of in vitro samples, again showing replicate clustering.

