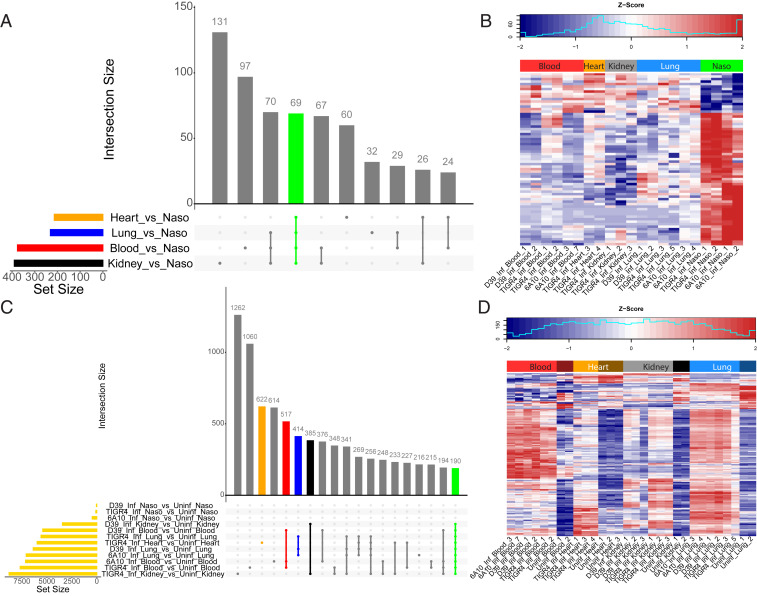
Fig. 4.
DE genes detected in the pneumococcus and host. (A) Upset plot of Spn DE genes (Dataset S4). The individual or connected dots represent the various intersections of genes that were either unique to, or shared among comparisons, similar to a Venn diagram. Vertical bars represent the number of DE genes unique to specific intersections. Horizontal bars represent the number of DE genes for each specific comparison. (B) A z-scored heatmap of expression levels of 69 Spn DE genes shared across all comparisons (green vertical bar from A). (C) Upset plot of host DE genes (Dataset S5). Horizontal gold bars represent the total number of host DE genes for that comparison. Colored vertical bars represent intersections of interest (i.e., specific to the infection of heart, blood, lungs), and an overall infection response in organs susceptible to invasive disease (orange, red, blue, and green vertical bars respectively). (D) A z-scored heatmap of expression levels of 190 host DE genes shared across all comparisons except the nasopharynx (i.e., shared across disease anatomical sites) (green vertical bar from C).

