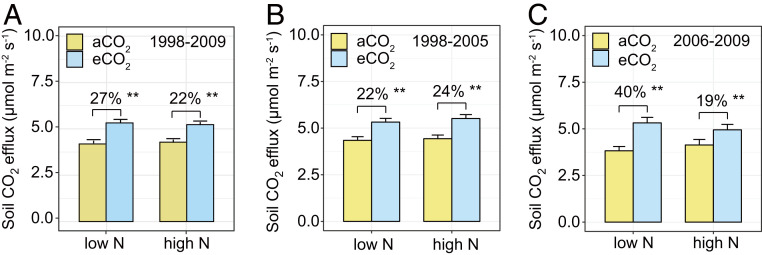
Fig. 1.
Observed responses of soil CO2 efflux to eCO2 at different N supply levels. (A) Soil CO2 efflux from 1998 to 2009. (B) Soil CO2 efflux from 1998 to 2005 (phase I). (C) Soil CO2 efflux from 2006 to 2009 (phase II). Each bar shows the annual mean plus SE of 74 plots. Percent changes of soil CO2 efflux in eCO2 plots relative to aCO2 plots are labeled above the bars. P values of the permutation t test are labeled **P < 0.01.

