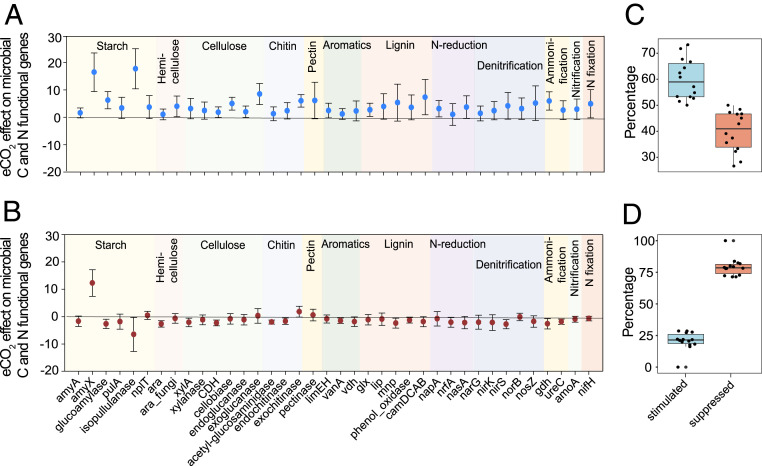
Fig. 2.
eCO2 effects on microbial functional genes important to C and N cycling at low and high N supply. Response ratios of functional genes at (A) low N supply and at (B) high N supply. Individual functional genes detected by GeoChip are shown on the x axis. Error bars indicate 95% confidence intervals of gene abundance difference between eCO2 and aCO2. (C) The percent of significantly shifted microbial gene probes stimulated (blue) versus suppressed (orange) by eCO2 at low N supply and (D) at high N supply. Percentages of stimulated and suppressed gene probes were averaged across gene probes in each gene category (each point in the boxplot) relevant to C, N, and P cycling. These gene categories (n = 14) include starch, hemicellulose, cellulose, chitin, pectin, aromatics and lignin degradation, N reduction, denitrification, ammonification, nitrification, N fixation, and phosphate limitation and phosphorus utilization.

