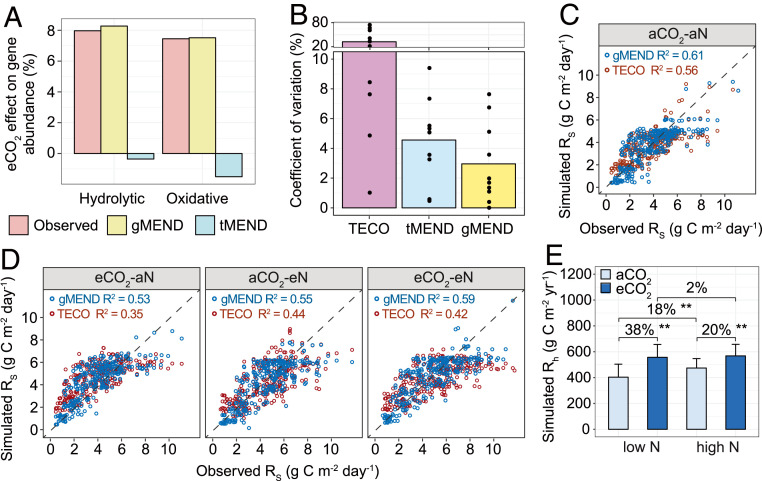
Fig. 3.
Model simulations. (A) Comparison of eCO2-induced percent changes of hydrolytic and oxidative enzymes observed by GeoChip to the simulated effects by gMEND and traditional MEND without gene information (tMEND) at low N supply. The GeoChip data were obtained from the samples from 2009. (B) Parameter uncertainty quantified by the coefficient of variation (CV) for the nonmicrobial C-only TECO, tMEND, and gMEND models; the bars show mean CV of 10 calibrated parameters represented by dots. (C) Model calibration with the soil respiration (Rs, 1998 to 2009) at aCO2-aN. (D) Model validations were performed using Rs at eCO2-aN, aCO2-eN, and eCO2-eN for gMEND and TECO. (E) Percent changes of gMEND-simulated heterotrophic respiration (Rh) between different CO2 and N levels. The error bars represent SEs. P values of the permutation t test are labeled as **P < 0.01.

