Fig. 3.
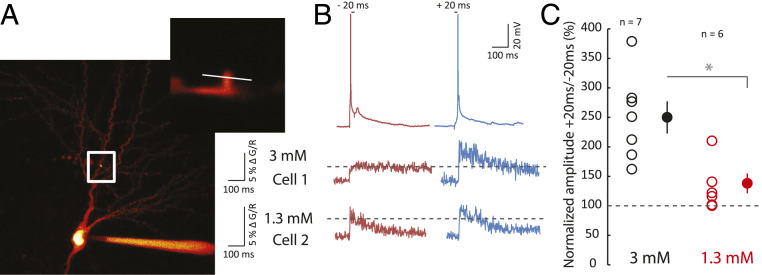
Calcium imaging. (A) Comparison of calcium spine entry during negative and positive pairing in 3 and 1.3 mM extracellular calcium. Calcium was measured in the spine of a CA1 pyramidal cell loaded with 50 µM Fluo-4. White square, location of enlarged area. The white line indicates the line scan on the dendritic spine. (B) Each neuron was alternatively tested for negative (Δt = −20 ms) and positive pairing (Δt = +20 ms). Cell 1 recorded in 3 mM calcium displays a much larger influx of calcium in response to positive pairing than negative pairing. Cell 2 recorded in 1.3 mM calcium displays an almost equal calcium rise. (C) Pooled data of the normalized ratio of calcium evoked by positive pairing over negative pairing (*P < 0.01, Mann–Whitney U test).

