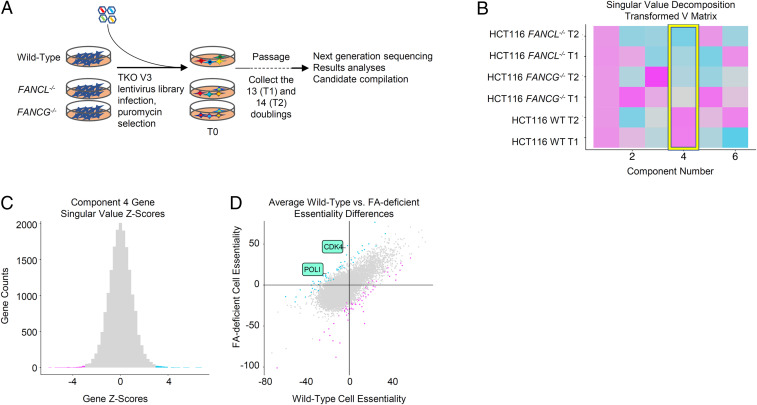
Fig. 1.
FA mutant synthetic lethality screen. (A) Schematic diagram depicting the gRNA-mediated whole genome fitness screen. (B) Resulting SVD v matrix of processed quantile-normalized BAGEL essential scores (BF) of FA-deficient and wild-type screens. Color similarity in the matrix represents the direction and amount of signal that is contributing to the individual component. (C) Histogram of Z-transformed component 4 scores coming from matrix u singular values, representing genetic contribution to differences between the FA knockouts and wild-type samples shown in the v matrix above. Blue, Z < −3; pink, Z > 3. (D) Comparison of mean BF scores in the FANCL−/− and FANCG−/− screens versus wild-type screen, colored as in C.

