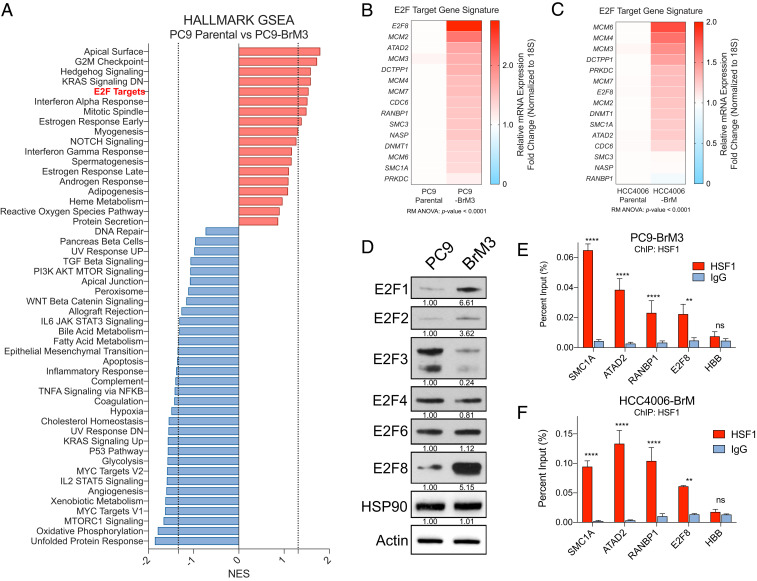
Fig. 3.
Brain-metastatic lung cancer cells exhibit increased expression of E2F target gene signatures and exhibit HSF1 binding at E2F target genes. (A) Waterfall plot of Hallmark GSEA signatures from RNA-seq data ranked by NES for PC9 parental vs. PC9-BrM3 cells. Negative NES, depleted signature; positive NES, enriched signature. Dotted line represents P value cutoff <0.05. (B and C) Heatmaps of mRNA expression (RT-qPCR) for E2F target genes in PC9 parental vs. PC9-BrM3 cells (B) or HCC4006 parental vs. HCC4006-BrM cells (C). (D) Immunoblot analysis of the indicated proteins expressed in PC9 parental vs. PC9-BrM3 cells. Quantification of protein expression was normalized to actin loading control and parental expression. (E and F) ChIP-qPCR analysis of HSF1 occupancy at degenerate HSEs nearby the indicated E2F target genes in PC9-BrM3 (E) or HCC4006-BrM cells. HBB (Hemoglobin) gene included as negative control. n = 3 biological replicates. For all experiments, *P < 0.05; **P < 0.01; ***P < 0.005; ****P < 0.001; ns, not significant.

