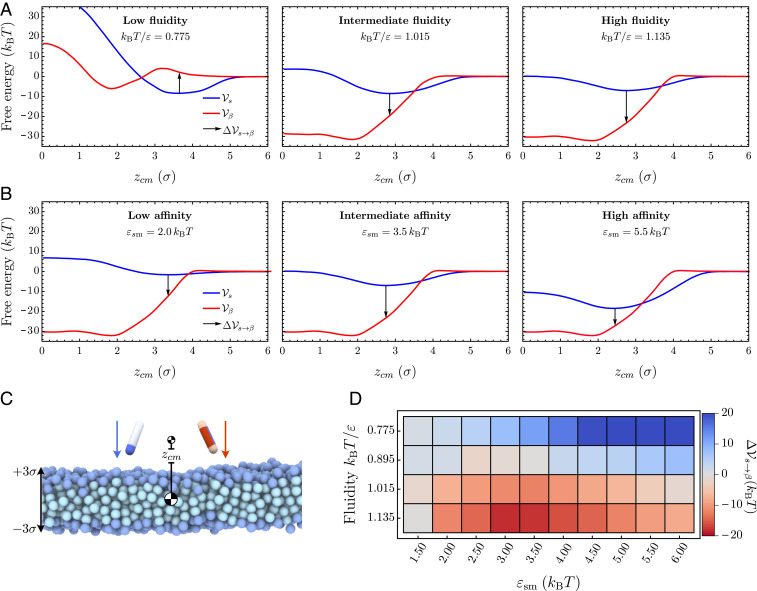
Fig. 4.
Changes in the potential of mean force at increasing membrane fluidity. (A and B) The three graphs each show the free-energy profiles (red) and (blue) at increasing fluidities , and 1.135, while protein–membrane interactions are kept fixed at and (A), and at increasing protein–membrane affinities , and , while the fluidity is kept fixed at and (B). The arrows indicate the free-energy cost for conformational conversion , providing a proxy for the nucleation barrier. (C) Initial snapshot of umbrella simulations for both particle species. (D) Difference between potentials of mean force in the “” and “” conformation evaluated at the minimum of as a function of the membrane fluidity and the membrane–protein affinity .

