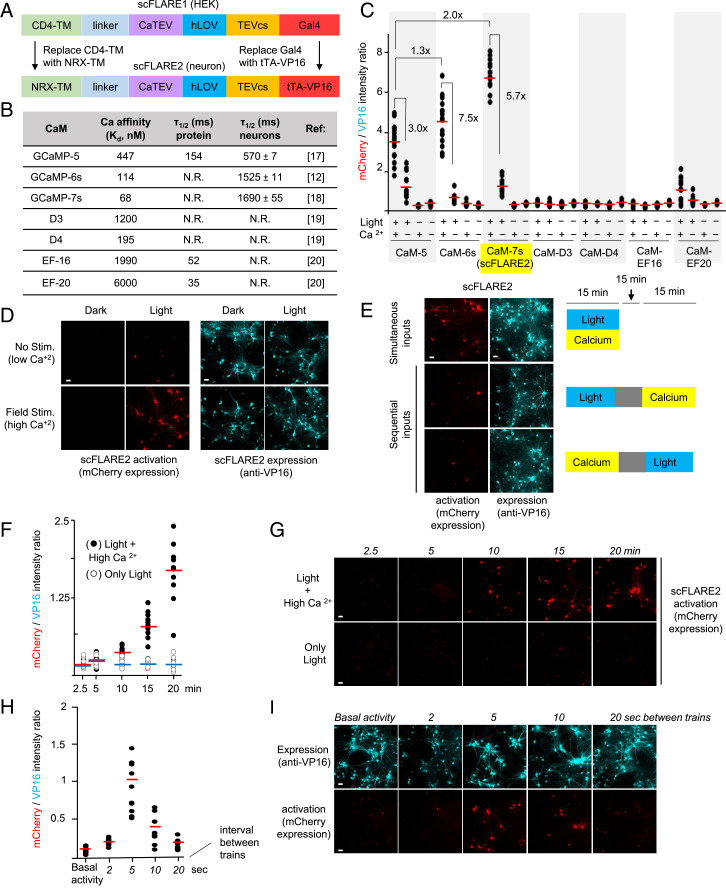
Fig. 3.
scFLARE2 characterization in neurons. (A) Summary of how scFLARE1 was converted to scFLARE2 for use in neurons. (B) Table of CaM variants tested in scFLARE. (C) Screening results for CaM variants in scFLARE. Rat cortical neuron cultures were transduced with scFLARE and TRE:mCherry AAV1/2s. At DIV18, neurons were stimulated with light (467 nm, 60 mW/cm2, 33% duty cycle (2 s every 6 s)) and high Ca2+ (5-s electrical trains consisting of 32 1-ms 50-mA pulses at 20 Hz) for 15 min. Neurons were fixed, immunostained with anti-VP16 antibody, and imaged by confocal microscopy 18 h later. Quantitation of mCherry intensity divided by scFLARE expression (VP16 intensity) was performed across 10 fields of view per condition (red bar, mean). This experiment was performed twice. (D) Confocal images of the best scFLARE variant (scFLARE2) from the experiment in C (scale bars, 10 μm). (E) scFLARE2 is specific for simultaneous (top row) rather than sequential (middle and bottom rows) light and calcium inputs. Ca2+ was elevated by electrical stimulation as in C. In the case of sequential inputs, a 15-min pause separated the two inputs. This experiment was repeated twice. SI Appendix, Fig. S6 shows the same experiment with only a 1-min pause between sequential inputs. (F) scFLARE2 time course. The same conditions as in C were used, but stimulation times varied from 2.5 min to 20 min. Red lines, mean (light + high Ca2+ condition). Blue lines, mean (only light condition). This experiment was performed twice. (G) Representative confocal images from the experiment in F. Additional fields of view are shown in SI Appendix, Fig. S7. (H) scFLARE2 activation is dependent on stimulation frequency. The same conditions as in C were used, but the frequency of electrical stimulation delivered varied from 2 to 20 s over a period of 15 min. Red lines, mean of 10 fields of view per condition. This experiment was performed twice. (I) Representative confocal images from the experiment in H. Additional fields of view are shown in SI Appendix, Fig. S8.

