Fig. 4.
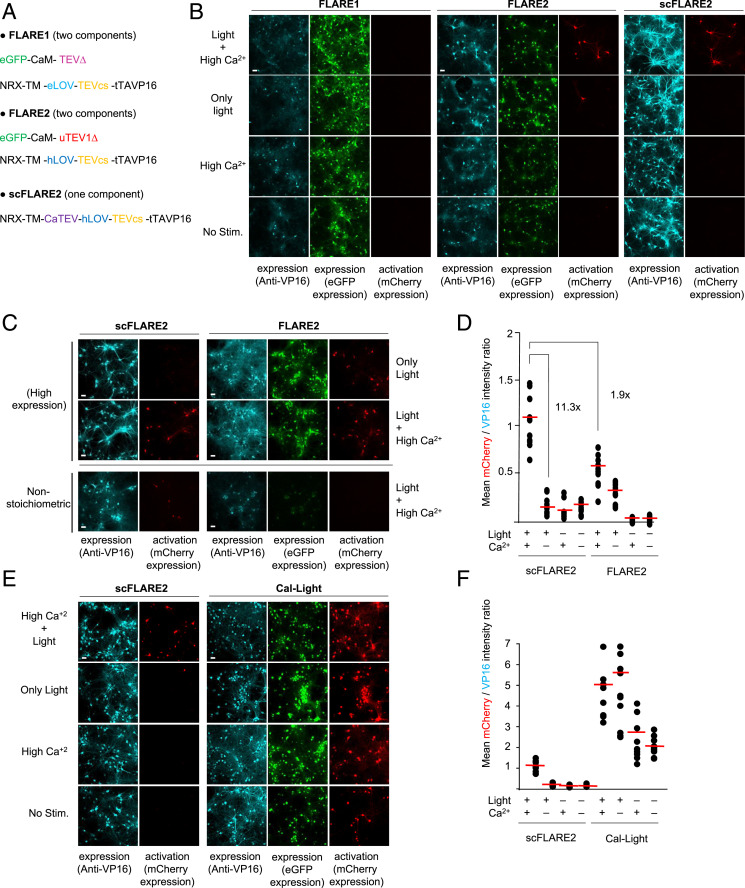
scFLARE2 comparison to FLARE1/2 and Cal-Light. (A) The constructs used to test FLARE1, FLARE2, and scFLARE2 in neurons. FLARE2 differs from FLARE1 in its protease and LOV domain (16). (B) A comparison of FLAREs in rat cortical neuron cultures. The neurons were transduced with AAVs encoding the indicated constructs and TRE:mCherry. At DIV18, neurons were stimulated with light (467 nm, 60 mW/cm2, 33% duty cycle [2 s every 6 s]) and electrical field stimulation to raise intracellular Ca2+ (5-s electrical trains consisting of 32 1-ms 50-mA pulses at 20 Hz) for 15 min. Neurons were fixed, immunostained with anti-VP16 antibody, and imaged by confocal microscopy 18 h later. (C) A more detailed comparison of scFLARE2 and FLARE2 at different expression regimes. For high expression, neurons were transduced with fourfold more virus than typically used. For nonstoichiometric expression, we used 0.25:1 ratio of protease:TF for FLARE2 rather than the typical 1:1 ratio. Otherwise conditions were the same as in B. (D) A quantification of the experiment in C (high expression condition). The mCherry/VP16 intensity ratio is plotted for 10 fields of view per condition. Red lines, mean. This experiment was performed twice. Additional fields of view are shown in SI Appendix, Fig. S10. (E) A comparison of scFLARE2 and Cal-Light (7). The rat cortical neuron cultures were transduced with AAV1/2s encoding scFLARE2 or Cal-Light constructs along with TRE:mCherry. The stimulation and imaging conditions were the same as in B. This experiment was performed twice. Additional fields of view are shown in SI Appendix, Fig. S11. (F) A quantification of the experiment in E. Scale bars, 10 μm.

