Fig. 6.
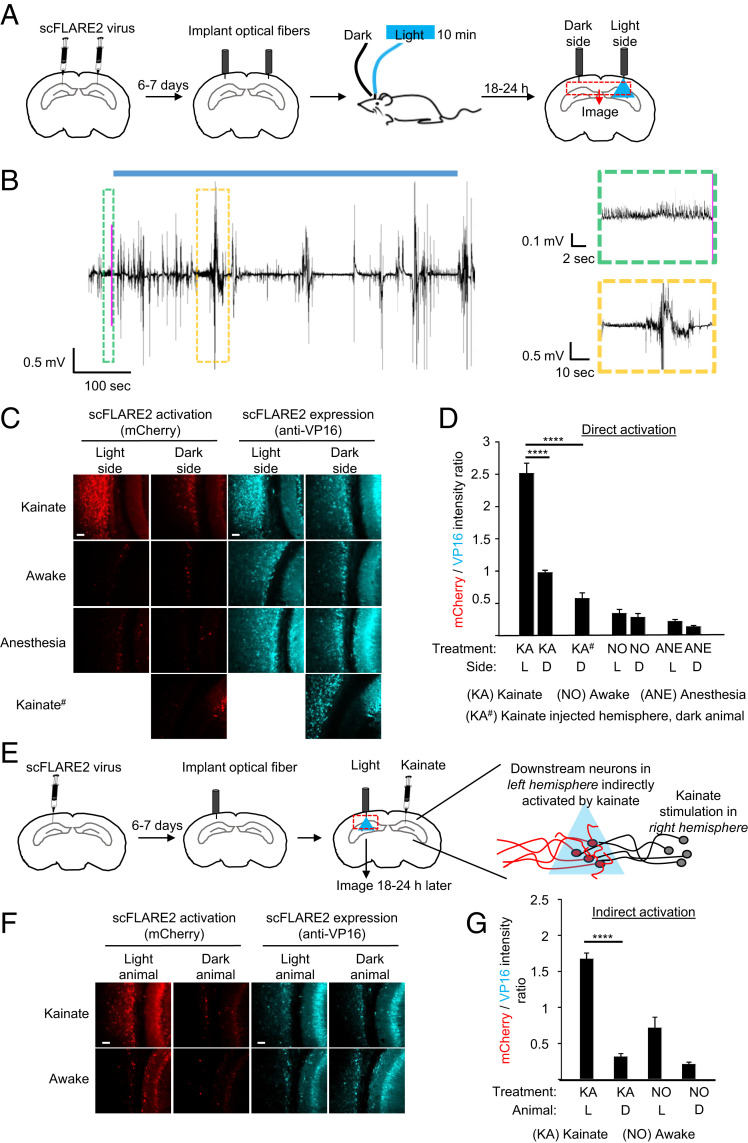
scFLARE2 labeling in vivo. (A) Concentrated AAV viruses encoding scFLARE2 and TRE:mCherry were injected bilaterally into the hippocampus and cortex of adult mice. After 6 to 7 d of expression, an optical fiber was implanted in both left and right hemispheres, and blue light was delivered to the right hemisphere via the optical fiber (single 10-min session of 473-nm light at 10 mW, 50% duty cycle [2 s light every 4 s]), while mice were subject to either kainate treatment (right hemisphere, dispensed 2 h before light treatment), regular awake conditions (no treatment), or anesthesia. Mice were perfused and immunostained for imaging analysis 18 to 24 h later. (B) An example EEG trace recorded around the time of light stimulation (blue bar). The pink line indicates when the seizure detection system detected a seizure and light delivery was started. The green boxed region shows the EEG signal leading up to the light trigger. The yellow boxed region is an EEG signal showing an example behavioral seizure occurring during the light stimulation. (C) Representative confocal fluorescence images of both hemispheres, following the experiment in A. Activated scFLARE2 drives expression of mCherry (in red), while immunostaining for VP16 (in cyan) shows expression of the tool (scale bars, 10 μm). (D) Quantification of scFLARE2 activation. For each brain hemisphere, we quantified the total mCherry fluorescence intensity divided by scFLARE expression across seven consecutive brain sections around the virus injection site (three to five fields of view for each section). A total of four to six mice per condition were analyzed. See SI Appendix, Fig. S13 for additional fields of view from several animals. The errors bars reflect the SEM; ****P < 0.0001; one-way ANOVA with Tukey post hoc test. (E) To label downstream neurons indirectly activated during seizure, concentrated AAV viruses encoding scFLARE2 and TRE:mCherry were injected into the hippocampus and cortex of adult mice in the left hemisphere contralateral to kainate injection (right hemisphere). After 6 to 7 d of expression, an optical fiber was implanted and blue light was delivered to the left hemisphere (same parameters as in A), while mice were subject to either kainate treatment (dispensed 2 h before light treatment) or regular awake conditions (no treatment). Mice were perfused and immunostained for imaging analysis 18 to 24 h later. (F) Representative confocal fluorescence images of the left hemisphere. Activated scFLARE2 drives expression of mCherry (in red), while immunostaining for VP16 (in cyan) shows expression of the tool (scale bars, 10 μm). See SI Appendix, Fig. S14 for additional fields of view from several animals. Negative controls are from animals not receiving any light. (G) Quantification of scFLARE2 activation. For each animal (2 mice per condition), we quantified the total mCherry fluorescence intensity divided by scFLARE expression across seven consecutive brain sections around the virus injection site (three to five fields of view for each section). Errors bars reflect the SEM; ****P < 0.0001; one-way ANOVA with Tukey post hoc test.

