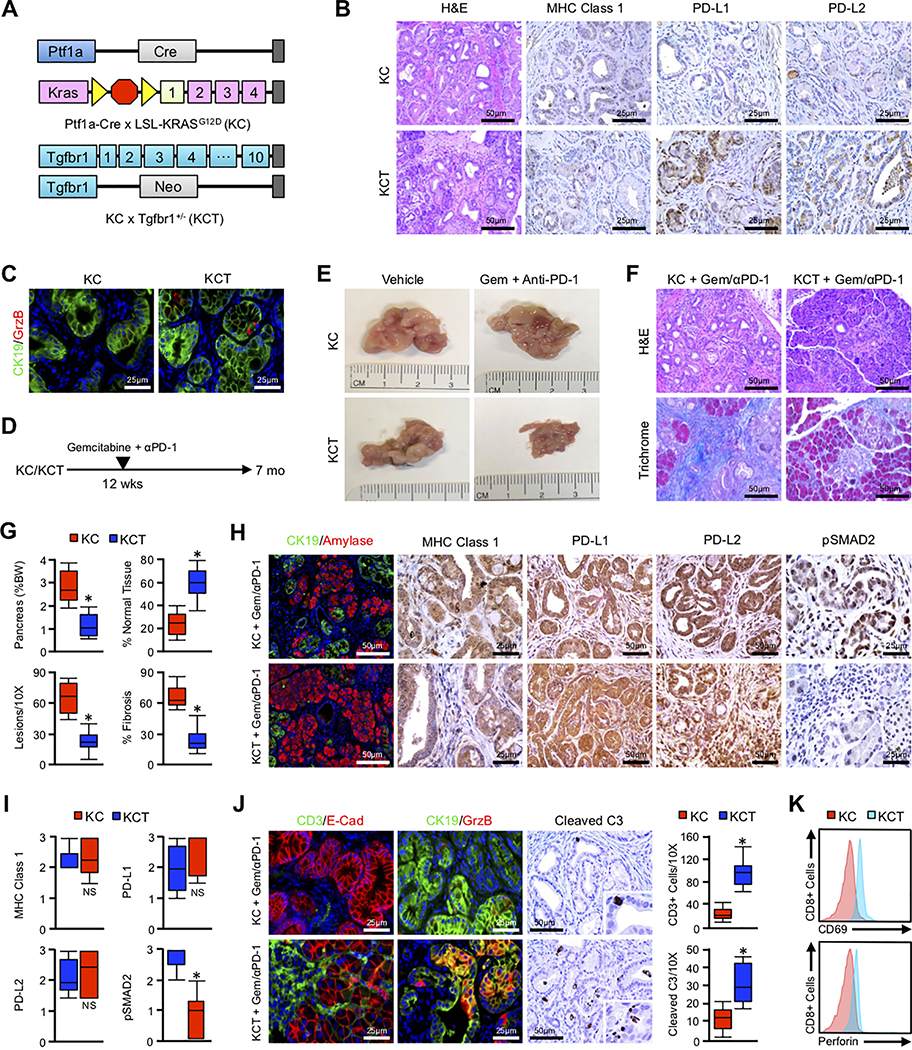
Figure 5. TGFβ functions as a cytokine barrier impeding the efficacy of combined Gemcitabine and anti-PD-1.
(A-C) Ptf1a-Cre x LSL-KrasG12D (KC) mice were bred to generate a model of conditional expression of oncogenic KRASG12D. KC mice were also crossed to the Tgfbr1 haplo-insufficient animals to generate KC/Tgfbr1+/− (KCT). Tissues were collected at six months and stained with H&E, or via immunohistochemistry for MHC Class 1, PD-L1, or PD-L2 (N=6/group). (C) The anti-tumor immune response of KC and KCT mice was evaluated by dual staining for the duct cell marker CK19 (green) and the cytotoxic surrogate GranzymeB (GrzB, red). (D) KC and KCT mice were allowed to reach 12 weeks of age, and randomized at a 50:50 male to female ratio into one of two groups. Mice were either administered intraperitoneal injection every other day of either a vehicle control (Vehicle, N=3/group) or 200μg of an anti-PD-1 neutralizing antibody (Anti-PD-1) with twice-weekly doses of 100mg/kg Gemcitabine (Gem + Anti-PD-1, N=3–7/group). (E) The pancreas was collected at the conclusion of the study (100 days post enrollment), and gross changes in pancreas gland structure evaluated. Representative images from each group are displayed. (F,G) The pancreas from control and drug treated mice was stained with either H&E or Masson’s Trichrome allowing for evaluation of changes in histopathology and fibrosis respectively. Tissue sections were quantified by three blinded investigators, averaged, and displayed as box plot. Additionally, the pancreas was weighed at the time of tissue collection, normalized to bodyweight, and displayed accordingly. (H,I) Tissue sections were also stained via immunohistochemistry for the duct marker CK19 and amylase, MHC Class 1, PD-L1, PD-L2, and the TGFβ surrogate pSMAD2 (N=3–7/group). Tissue sections were quantified as described and displayed as box plot (*p < 0.05, NS = non-significant where p > 0.05). (J) The pancreas from control and drug-treated mice were dual-stained for the T-cell marker CD3 and the epithelial surrogate E-Cadherin (E-Cad), for the duct cell marker CK19 and the cytotoxic surrogate GranzymeB (GrzB), or for the apoptotic surrogate Cleaved Caspase 3 (Cleaved C3). Tissue sections were quantified as described and displayed as box plot (p < 0.05). (K) Mesenteric lymph nodes from drug treated mice were collected, and evaluated for CD8+CD69+ or CD8+Perforin+ cells.

