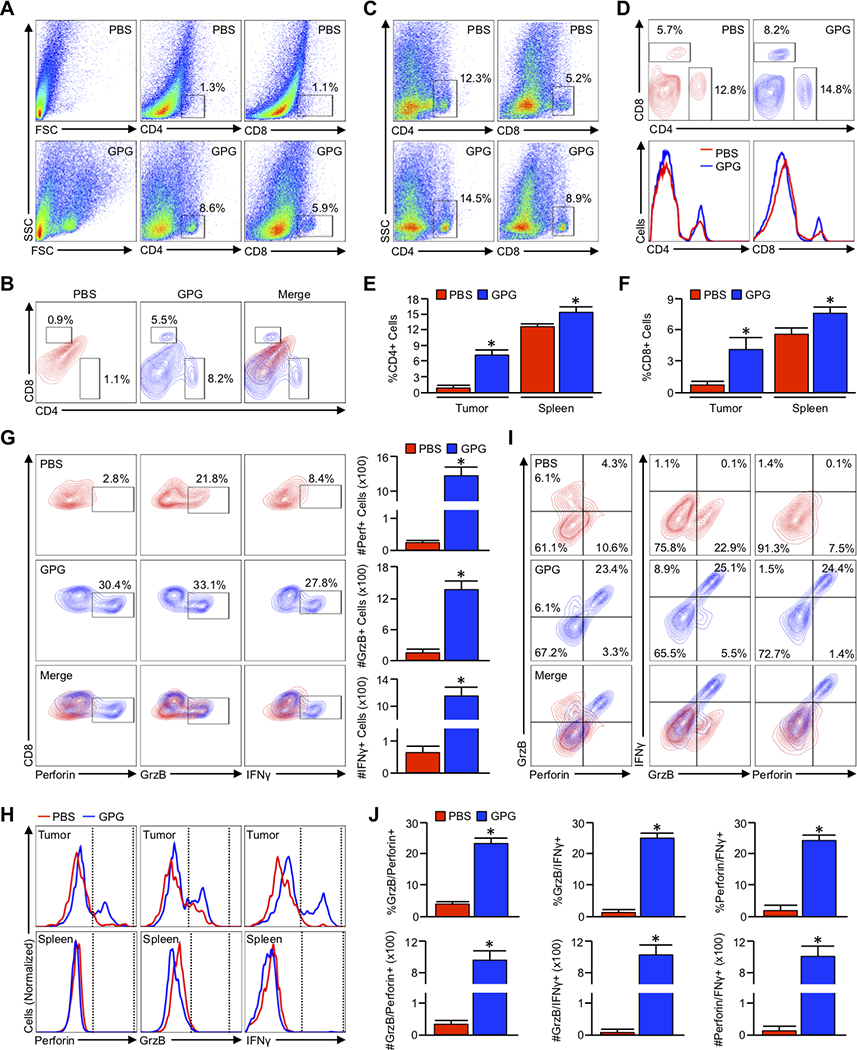
Figure 7. Combining Gemcitabine, Galunisertib, and anti-PD-1 leads to intratumoral accumulation and activation of cytotoxic T lymphocytes.

(A,B) Pdx1-Cre x LSL-KrasG12D x LSL-TP53R172H (KPC) mice were again used as a model of aggressive PDAC. At 90 days (~13 weeks) of age, mice were administered an intraperitoneal injection every other day of either saline (PBS) or twice-weekly Gemcitabine starting at 90 days with the addition of Galunisertib and anti-PD-1 two weeks later (G/P/G). The pancreas was then collected either when the animals were moribund or at the conclusion of the study (150 days post enrollment) and analyzed by flow cytometry for tumor infiltrating CD4+ and CD8+ T-cells, respectively (N=3/group). (C,D) The spleens from both PBS and GPG-treated mice were collected and analyzed as described for CD4+ and CD8+ T-cells. (E,F) The relative percent of total cells positive for CD4 and CD8 from both the tumor and spleen of PBS and GPG treated mice (*p < 0.05). (G) Tumor infiltrating cells were gated based on the CD8 and CD4 staining shown above, and CD8+ events isolated and analyzed for expression of cytotoxic T-cell activation markers Perforin (Perf), GranzymeB (GrzB), and Interferon γ (IFNγ). The percent of CD8+ cells positive for each activation marker was normalized to the total number of CD8+ T-cells per 100,000 events, and displayed to the right of the flow cytometry plots (*p < 0.05). (H) The modal expression of Perforin, GranzymeB, and IFNγ within both intratumoral and splenic CD8+ T-cells are displayed as a histogram plot. (I) CD8+ cells were gated as previously, and analyzed for the simultaneous expression of the aforementioned T-cell activation markers including GranzymeB and Perforin, GranzymeB, and IFNγ, as well as Perforin and IFNγ. (J) Using the described gating, the relative percent of GranzymeB+Perforin+, and GranzymeB+IFNγ+, and Perforin+IFNγ+ are plotted, as are the absolute number of each per 100,000 events (*p < 0.05).
