Figure 1.
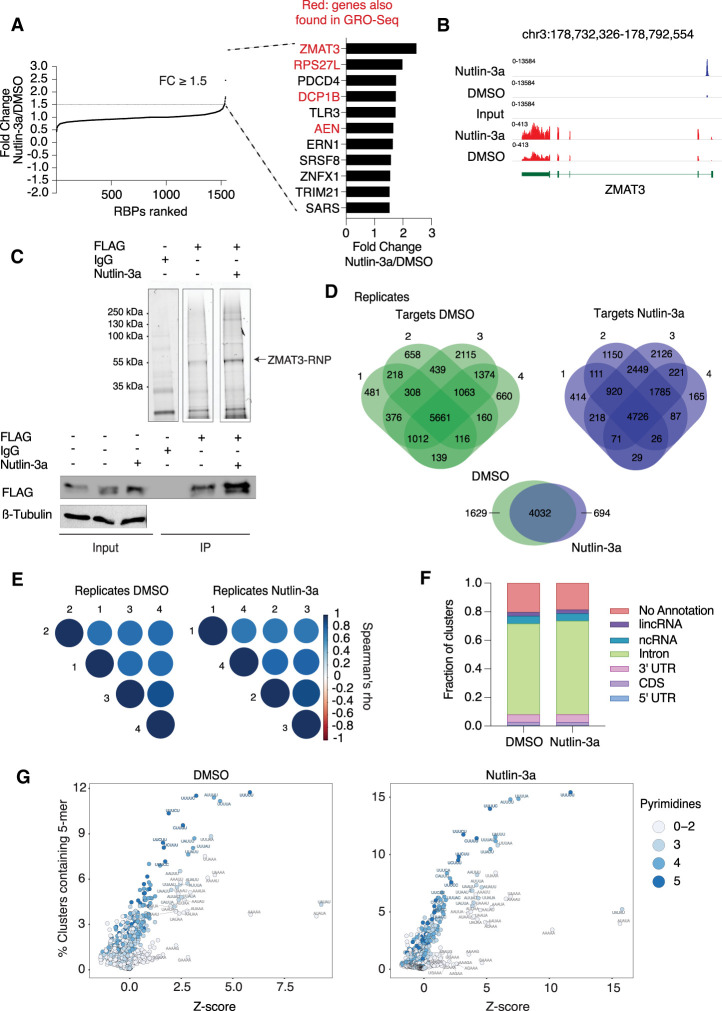
ZMAT3 is the top RBP up-regulated by p53 and binds to thousands of pre-mRNAs at uridine rich sequences. (A) RBPs in HCT116 cells ranked according to their fold change upon activation of p53 by Nutlin-3a samples compared with DMSO. The 11 up-regulated RBPs sorted in decreasing order of up-regulation by p53 (fold change ≥ 1.5 and P < 0.05 as cutoff). Red font indicates whether their transcriptional activity increased upon p53 stimulation in GRO-seq experiments (Allen et al. 2014). (B) Genome browser snapshot from p53 ChIP-seq (blue tracks) and RNA-seq (red tracks) samples using HCT116 cells treated with Nutlin-3a or DMSO. ChIP-seq data were obtained from Andrysik et al. (2017). (C) Representative ZMAT3 PAR-CLIP images. (Top) Fluorescent image of SDS-PAGE separating cross-linked ZMAT3-FLAG RNPs ligated to a fluorescent 3′ adapter after immunoprecipitation (IP) using anti-FLAG or IgG antibodies from HCT116 lysates with or without Nutlin-3a treatment. The fluorescent band migrating at ∼55 kDa, corresponding to the expected size of the ZMAT3-FLAG-RNA-3′ adapter complex, is indicated. The bottom panel shows control immunoblots before (input) and after IP stained for FLAG. (D, top panel) Venn diagrams of intersection of genes bound by ZMAT3 recovered from four independent PAR-CLIP experiments each after DMSO or Nutlin-3a treatment. (Bottom panel) Venn diagram of intersection of genes reproducibly bound by ZMAT3 in all replicates of PAR-CLIP after DMSO and Nutlin-3a treatments. (E) Correlogram using Spearman's correlation coefficient of cross-linked reads among PAR-CLIP samples replicates upon DMSO (right panel) or Nutlin-3a treatment (left panel). (F) Average of distribution of cross-linked sequence reads from four biological replicates across different annotation categories. (G) The dot plots depict Z-scores (X-axis) and frequency (Y-axis) for the occurrence of all 1024 possible 5-mers in ZMAT3 PAR-CLIP binding sites from HCT116 cells treated with Nutlin-3a (left) or DMSO (right). Shade of blue indicates the number of pyrimidines in the respective 5-mer.

