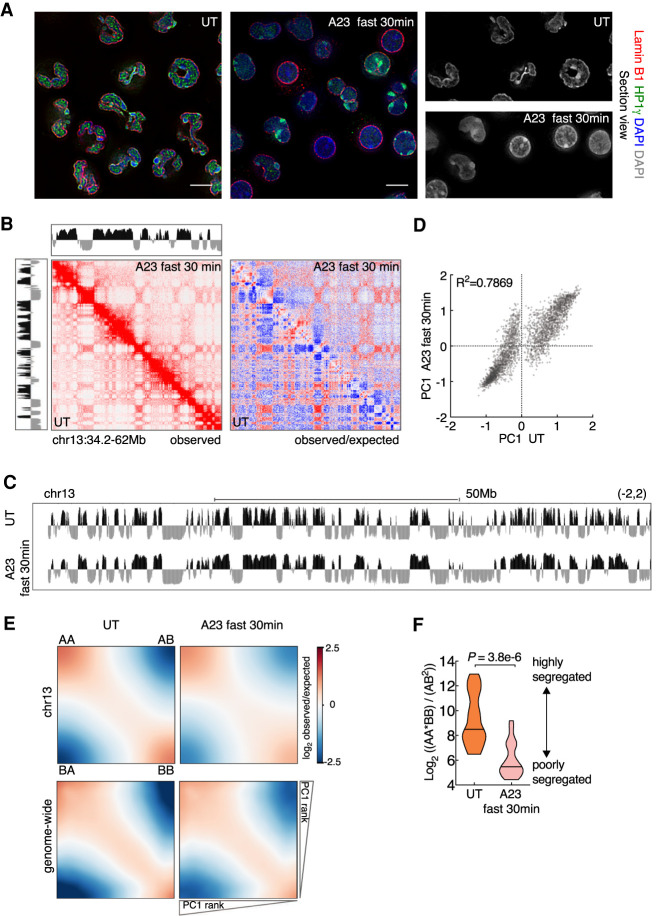
Figure 1.
Calcium entry triggers a weakening of compartmentalization. (A) Immunofluorescence images comparing nuclear morphology of untreated (UT) and A23187-activated (A23187 fast 30 min) neutrophils. Neutrophils were activated using fast activation condition (20 µM A23187) for 30 min. Nuclear lamina was stained using anti-LaminB1. Anti-HP1γ stained HP1γ that binds both euchromatin and heterochromatin. Counterstain with DAPI highlighted heterochromatin. Representative image sections are presented as digitally magnified images. Original magnification, ×100. Scale bars, 5 µm. (B) Hi-C contact matrices for chromosome 13 (34.2–62 Mb) in untreated and activated neutrophils. The intensity of each pixel represents the normalized number of contacts between a pair of loci. (Left) Observed contact maps were balanced normalized at 50-kb resolution with a color range of 0–20. (Right) Observed/expected contact maps were balanced normalized and distance normalized at 50-kb resolution with a color range of −4 to 4 (log2 ratio). Corresponding compartment profiles (PC1 tracks) at 25-kb resolution, indicating genomic regions positioned in the A (black) and B (gray) compartments are shown above and to the left of the matrix for activated and untreated neutrophils, respectively. (C) Genome browser tracks for PC1 spanning chromosome 13 in untreated and activated neutrophils. (D) Scatter plot for PC1 values of untreated versus activated neutrophils, defined at PC1 domain (PD) level is shown. Signals away from the diagonal indicate PDs that switched compartments. Pearson coefficients are indicated. (E) Saddle plots for compartmentalization strength in untreated (left panels) and A23187-activated (right panels) neutrophils. Average distance-normalized contact frequencies between cis pairs of 50-kb bins arranged by descending PC1 values. The top shows saddle plots for chr13. The bottom shows aggregated map constructed by averaging all chromosomes. (F) Violin plots comparing distributions of log2 ratios for average genomic interaction frequencies involving different compartments (AB) compared with those involving the same compartments (AA and BB). The median values are shown as central black lines. P-value, two-tailed Wilcoxon rank-sum test.

