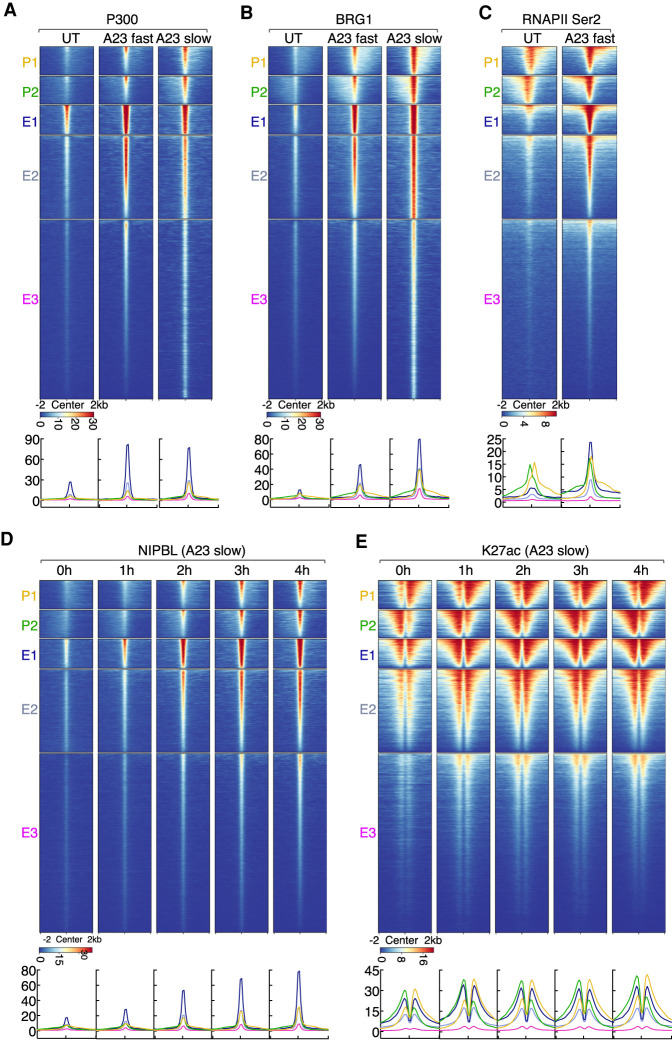
Figure 3.
Calcium signaling rapidly elevates with distinctive kinetics P300, BRG1, and RNAPII co-occupancy at NIPBL-bound enhancers and promoters. (A) Heat map displaying P300 ChIP-seq signals plotted for five clusters of genomic regions defined in Figure 2A. Heat map was sorted by the maximum signal intensity of P300 in A23187 fast activation conditions. (B) Heat map displaying BRG1 ChIP-seq signals plotted for five clusters of genomic regions defined in Figure 2A is shown. Heat map was sorted by the maximum signal intensity of BRG1 in A23187 fast activation conditions. (C) Heat map displaying RNAPIISer2 ChIP-seq signals plotted for five clusters of genomic regions defined in Figure 2A. Heat map was sorted by the maximum signal intensity of RNAPII in A23187 fast activation conditions. (D) Kinetics of NIPBL recruitment is shown. Heat map of NIPBL ChIP-seq signals was plotted for five clusters of genomic regions defined in Figure 2A. Heat map was generated by centering on the maximum signal intensity of NIPBL occupancy in A23187 slow activation conditions (4 h). (E) Kinetics of H3K27ac distribution is shown. Heat map of H3K27ac ChIP-seq signals was plotted for five clusters of genomic regions defined in Figure 2A. Heat map was sorted by centering on the maximum signal intensity of H3K27ac in A23187 slow activation conditions (4 h). (A–E) Below the heat maps are indicated the corresponding average enrichment plots.

