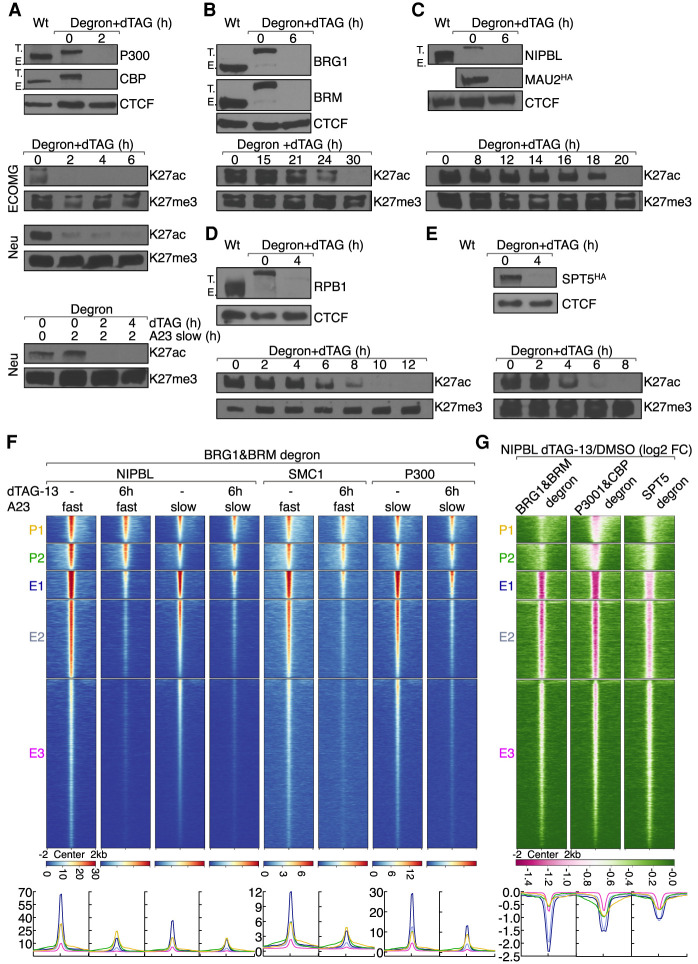
Figure 5.
Factors that directly orchestrate H3K27ac abundance and NIPBL occupancy. (A) The top panel shows Western blot validating dTAG-13 mediated depletion of P300 and CBP abundance in neutrophils expressing “P300&CBP degrons.” CTCF was probed to serve as a loading control. Note that successful biallelic tagging is shown by the higher-molecular-weight band (T.) and the lack of native-sized protein (E.) in CRISPR-modified cells. The bottom panels indicate Western blots showing changes in H3K27ac abundance upon dTAG-13-mediated P300 and CBP degradation. H3K27me3 was probed as a loading control. Whole-cell lysates were extracted from ECOMG cells, resting neutrophils, and activated neutrophils, respectively. (B) The top panel shows Western blot validating dTAG-13 mediated depletion of BRG1 and BRM abundance in neutrophils expressing “BRG1&BRM degrons.” Antibodies are indicated to the right. CTCF was probed to serve as a loading control. The bottom panel indicates Western blot showing showing changes in H3K27ac abundance upon dTAG-13-mediated P300 and CBP degradation. H3K27me3 was probed to serve as a loading control. Whole cell lysates were extracted from resting neutrophils. (C) As in B for NIPBL and MAU2 in “NIPBL&MAU2 degron” neutrophils. Note that MAU2 was blotted with anti-HA antibody. (D) As in B for RPB1 in “RPB1 degron” neutrophils. (E) As in B for SPT5 in “SPT5 degron” neutrophils. Note that SPT5 was blotted with anti-HA antibody. (F) Heat map of NIPBL, SMC1, and P300 ChIP-seq signals in activated neutrophils in the presence or absence of dTAG-13, plotted for five clusters of genomic regions defined in Figure 2A. Heat map was generated by gating on the maximum signal intensity of NIPBL occupancy using A23187 slow activation conditions. Below the heat map corresponding average enrichment plots are shown. Near-complete degradation was achieved by 6 h. Therefore, 6 h of dTAG-13 treatment was chosen to study the immediate consequences for loss of BRG1&BRM expression while minimizing indirect effects on transcription and genome organization caused by cell death. (G) Heat map of log2 FC of NIPBL ChIP-seq signals in dTAG-13 versus DMSO-treated activated neutrophils plotted for five clusters of regions defined in Figure 2A. Heat map was sorted by the minimum signal intensity of log2 FC of NIPBL in “P300&CBP degron” cells. Pink color indicates signal loss upon dTAG-13 treatment. Below the heat map is indicated the corresponding average enrichment plots with Y-axis values indicated as log2FC. Below the heat map are corresponding average enrichment plots. “BRG1&BRM degron,” “P300&CBP degron,” and “SPT5 degron” neutrophils were pretreated with dTAG-13 for 6, 2, and 4 h before activation, respectively.

