Figure 7.
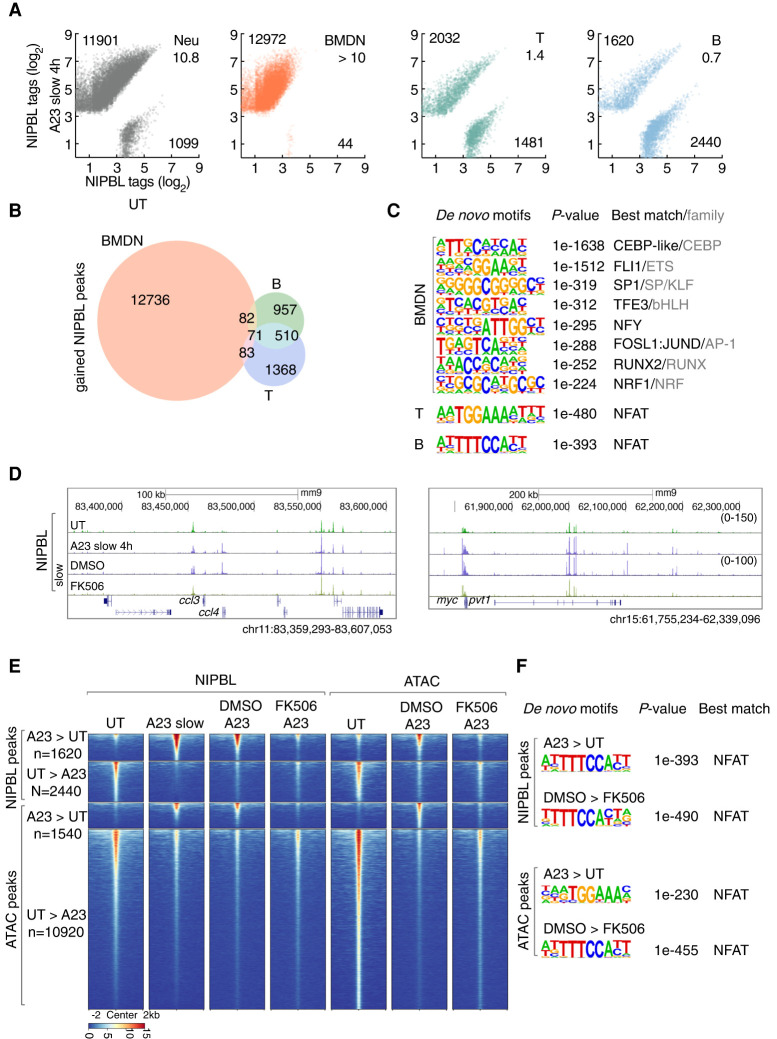
Calcium influx in primary immune cells modulates NIPBL occupancy. (A) Scatter plot for log2 tag counts for NIPBL peaks in untreated versus activated ECOMG-derived neutrophils, bone marrow-derived neutrophils (BMDN), primary T and B cells, respectively, assessed for a 200-bp region centered on differential NIPBL-bound sites. Numbers of gained and lost NIPBL-bound sites (FC > 4) and ratios between them are indicated. (B) Venn diagram showing overlap and specificity of gained NIPBL-binding sites in activated BMDN, primary T cells and B cells. Peaks were considered overlapping if the distance separating peak centers were <100 bp. Numbers of specific and overlapping bound sites are indicated for each group. (C) Motifs enriched in the vicinity of NIPBL-binding sites (± 200 bp) that were gained in activated BMDN, primary T cells and B cells using GC-matched genomic backgrounds, respectively. P-values for motif enrichment, the best-matched TF and TF family if applicable are indicated at the right of the sequence logos (cutoff: P < 1×10−100). (D) Genome browser tracks of NIPBL-bound sites derived from untreated and activated primary B cells cultured in the presence or absence of FK506 at representative loci, ccl4 and myc. (E) Heat map of NIPBL-bound sites and ATAC-seq signals in untreated and activated primary B cells cultured in the presence or absence of FK506, across genomic regions that were centered (±2 kb) on NIPBL-bound sites. (F) The top panels indicate motifs enriched within the vicinity of NIPBL-bound sites (±200 bp) that are gained in activated primary B cells using GC-matched genomic backgrounds. The bottom panels show motifs enriched in the vicinity of accessible chromatin regions defined by ATAC-seq (±200 bp) that were lost in activated primary B cells cultured in the presence of FK506 using GC-matched genomic backgrounds. P-values for motif enrichment, the best-matched TF and TF family if applicable, are indicated to the right of the sequence logos (cutoff: P < 1 × 10−100).

