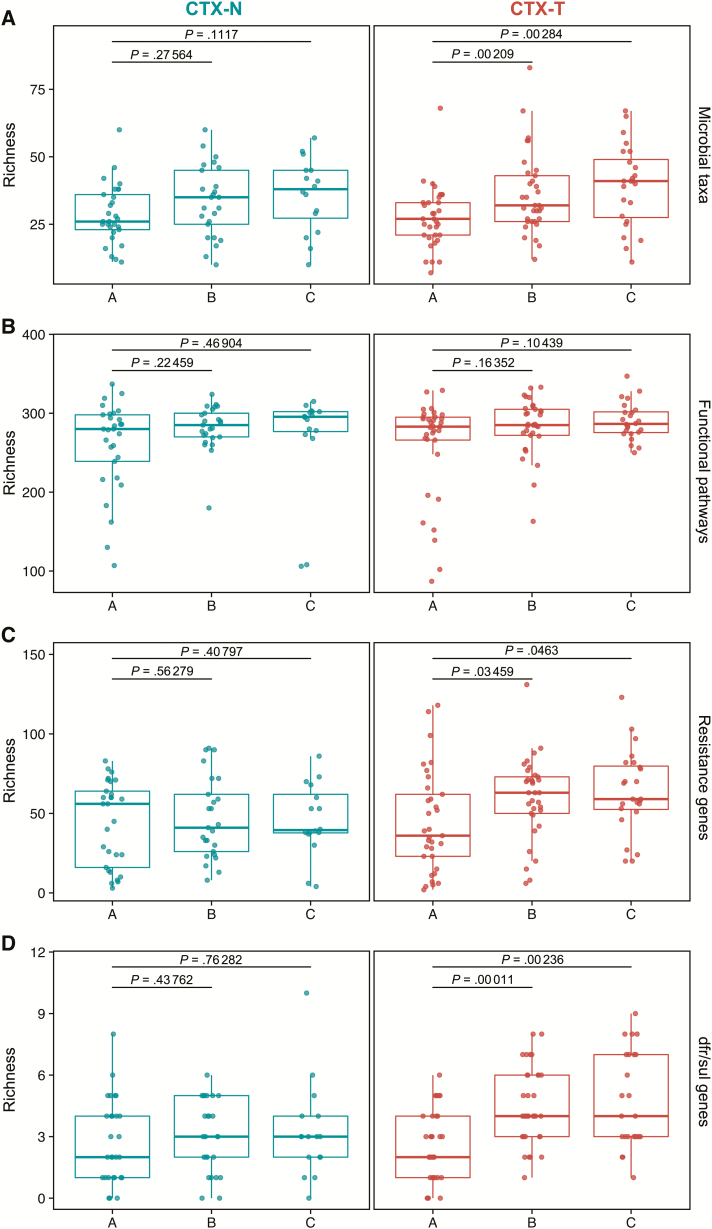
Figure 5.
Resistance richness (α-diversity) significantly increases over time in cotrimoxazole-treated human immunodeficiency virus–exposed, uninfected (HEU) infants (CTX-T) for total resistance genes and for dfr/sul resistance genes. Points represent richness values for individual samples, and boxes show median values (dark middle line) and first and third quartiles (lower and upper lines). The x-axis groups for each plot are the times of collection, and the y-axis for each plot is richness. Paired Wilcoxon tests (signed rank) were used to compare the latter 2 collections (timepoints B and C) to the first collection (timepoint A), and P values are reported above the graph with black lines depicting the comparisons. Graphs show HEU infants not treated with cotrimoxazole (CTX-N; blue) on the left and CTX-T infants (red) on the right. Richness was calculated for microbial taxa (A), functional pathways (B), resistance genes (C), and trimethoprim- and sulfonamide-resistance (dfr/sul) genes (D).

