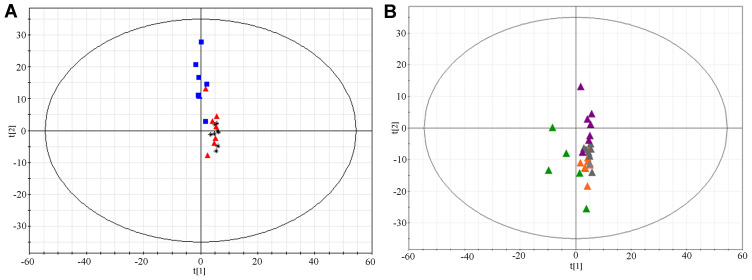
Figure 3.
Score-Plot of principal component analysis for different groups of rats. (A) Score-Plot of PCA for the serum samples collected from different groups 6 weeks after surgery. Black, sham group; Red, TN+vehicle group; and Blue, TN+curcumin group. (B) Score-Plot PCA for the serum samples collected at different time points after cobra venom intra-ION injection. Green, week 1; Orange, week 2; Grey, week 4; and Violet, week 6.

