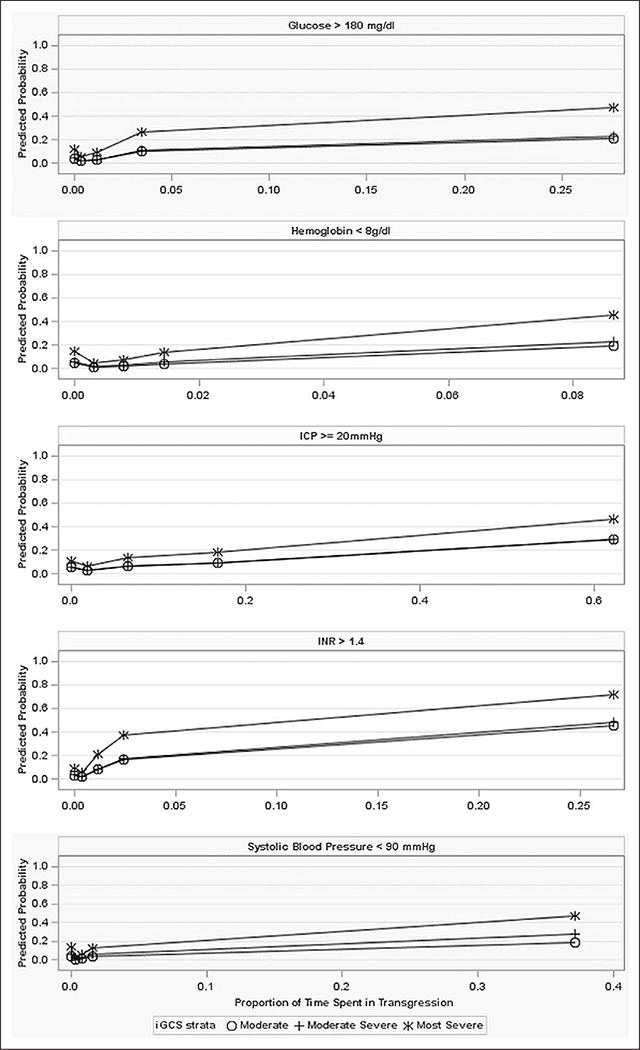
Figure 1.
The relationship between time spent in transgression and mortality. The proportion of observed hours spent in transgression is represented on the x-axis. An indicator located at x = 0, represents the class of subjects who did not experience the transgression. An indicator at the midpoint of each quartile represents increasing proportions of time spent in transgression. The y-axis represents the predicted outcome probability; a separate line is presented for each severity strata. Although the simple models from which these graphs are derived include adjustments for treatment and gender, these effects were not significant; the plots have therefore smoothed over treatment and gender to focus on the effect of duration. ICP = intracranial pressure, iGCS = initial Glasgow Coma Scale, INR = international normalized ratio.

