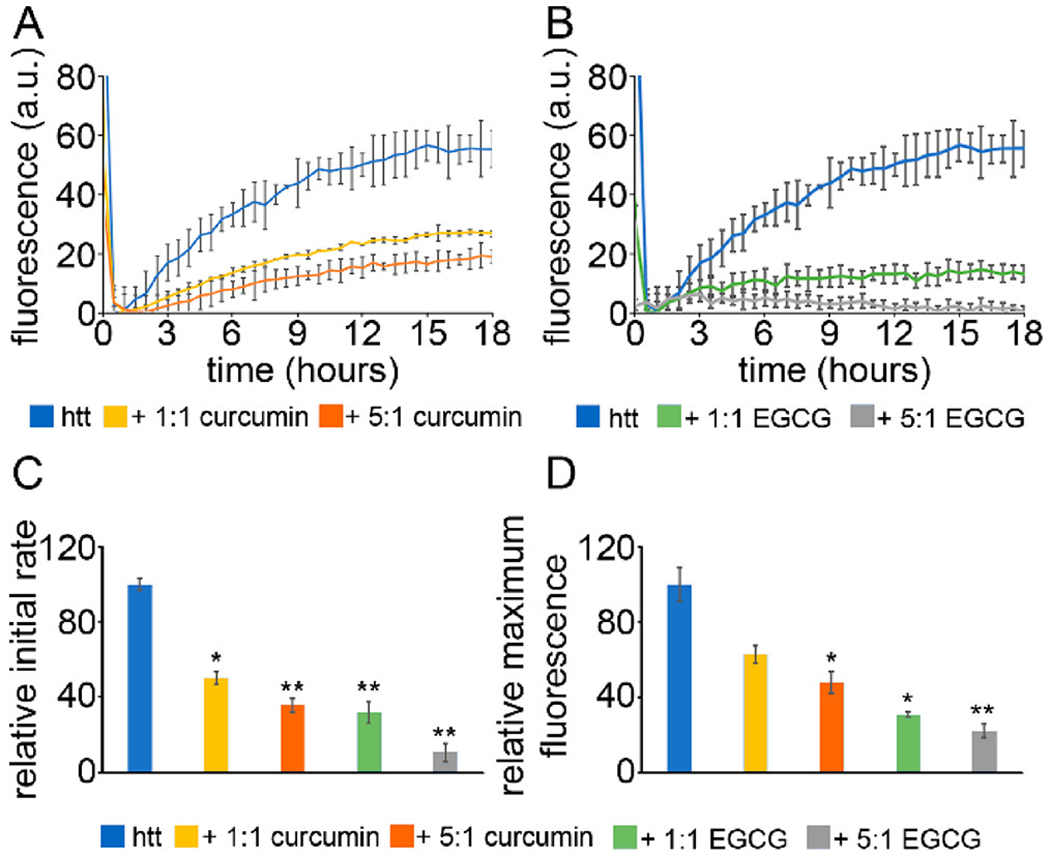
Figure 1.

ThT aggregation assays for htt-exon1(46Q) in the presence of (A) curcumin or (B) EGCG. The htt-exon1(46Q) concentration was 20 μM. (C) The initial rate of aggregation and (D) the relative maximum fluorescence were determined with respect to the htt control. Normalization was performed with respect to the htt control. Analyses shown in panels C and D were determined as averages over all trials (shown in Figure S2). Error bars are provided for every sixth data point (30 min) and represent the standard error of the mean. One asterisk represents a p value of <0.05, and two asterisks represent a p value of <0.01.
