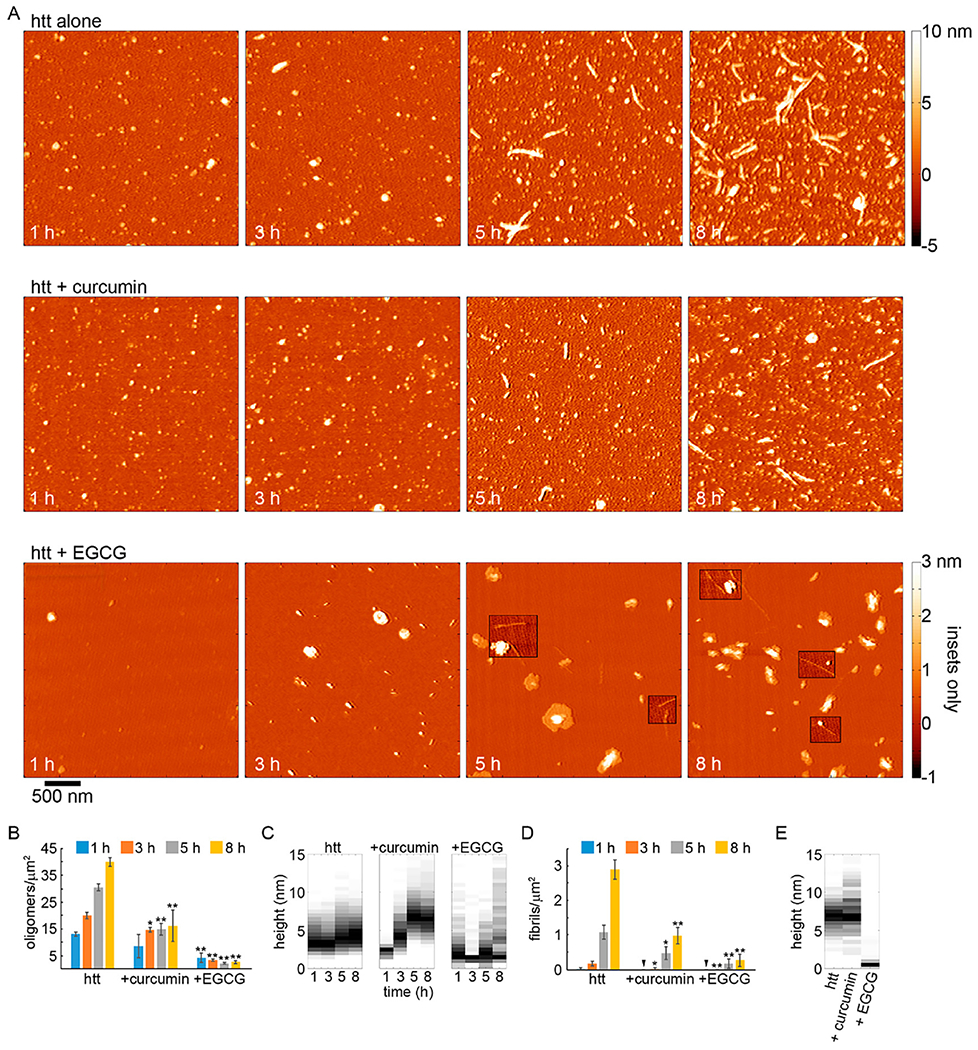
Figure 2.

AFM analysis of the impact of curcumin or EGCG on htt-exon1(46Q) aggregation (5:1 small molecule:htt ratio). (A) Representative AFM images of 20 μM htt-exon1(46Q) incubated alone, with curcumin, or with EGCG as a function of time. The color map is the same for all images (see the top color bar). The insets in the AFM images of htt incubated with EGCG use a reduced color map (see bottom, labeled color bar) to make the shorter fibrils in these samples easier to see. (B) Image analysis of the number of oligomers per unit area as a function of time. (C) Height histograms of oligomers observed in AFM images as a function of time. (D) Image analysis of the number of fibrils per unit area as a function of time. (E) Height histograms of fibrils observed in AFM images as a function of time. For panels B and D, error bars represent the standard deviation, one asterisk represents a p value of <0.05, and two asterisks represent a p value of <0.01 using a Student’s t test.
