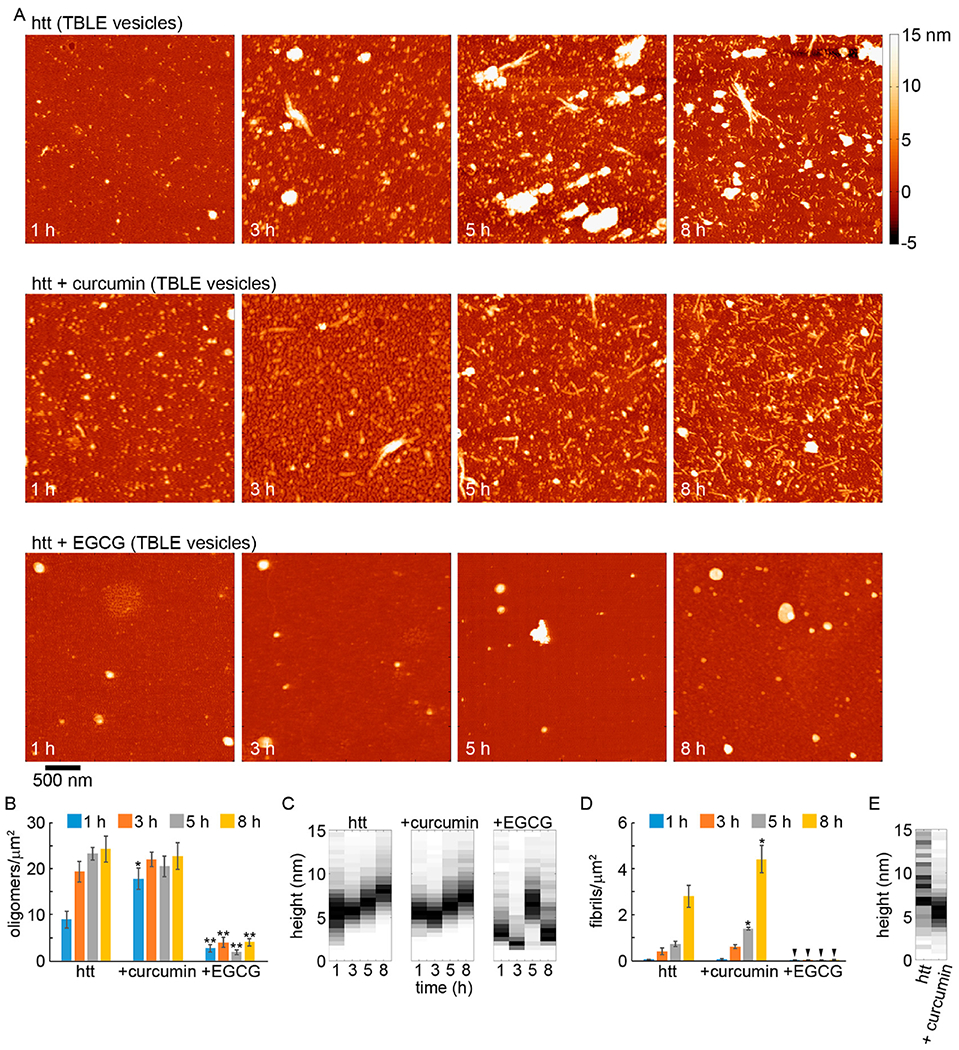
Figure 6.

AFM analysis of the impact of curcumin or EGCG on htt-exon1(46Q) aggregation (5:1 small molecule:htt ratio) in the presence of TBLE vesicles (20:1 lipid:protein ratio). (A) Representative AFM images of 20 μM htt-exon1(46Q) incubated with TBLE with no small molecules, with curcumin, or with EGCG as a function of time. The color map is the same for all images. (B) Image analysis of the number of oligomers per unit area as a function of time. (C) Height histograms of oligomers observed in AFM images as a function of time. (D) Image analysis of the number of fibrils per unit area as a function of time. Arrows indicate that no fibrils were observed. (E) Height histograms of fibrils observed in AFM images as a function of time. As fibrils were not observed for incubations of htt-exon1(46Q) with TBLE and EGCG, this condition is not presented in the fibril histograms. For panels B and D, error bars represent the standard deviation, one asterisk represents a p value of <0.05, and two asterisks represent a p value <0.01 using a Student’s t test.
